Visualizations can communicate study findings quickly and clearly. Rather than expecting reviewers to immediately understand results from grids of data, you can present summary plots showing relationships and trends that are meaningful at a glance. In this step we will generate our own charts and export them. We will make 2 charts:
- Chart 1 will show CD4 counts for different individuals over time
- Chart 2 will show how the mean CD4 counts vary for different groups/cohorts over time
Create a Time Chart
- Navigate to the Lab Results dataset. (Opens in a new tab.)
- On the data grid, select (Charts/Reports) > Create Chart.
- In the Create a plot dialog, click Time on the left.
- In the X-Axis panel, select Visit-based.
- Drag CD4 from the column list on the right into the Y Axis box.

- Click Apply.
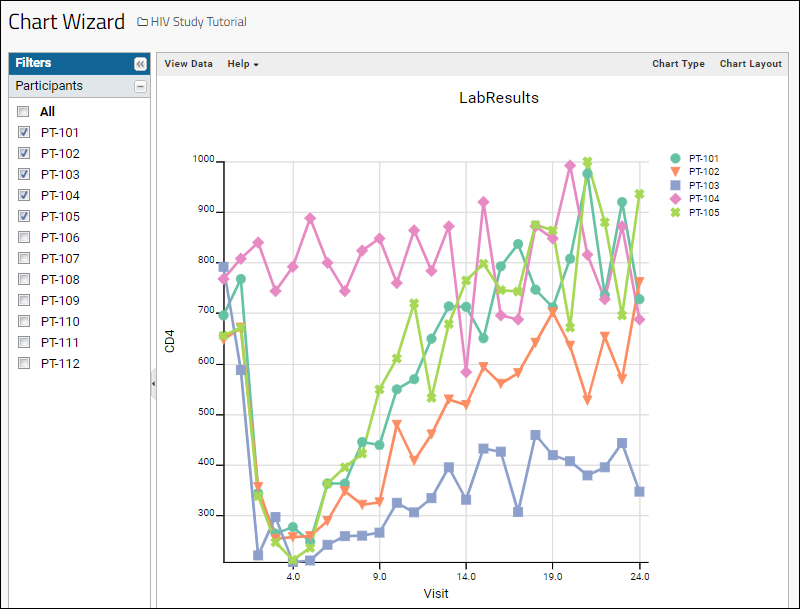
- You will see a time chart like the following image. By default, the first 5 participants are shown.
- In the left hand Filters panel, you can select individual participants to include in the chart. Clicking any value label will select only the given participant, checking/unchecking the box allows you to toggle participants on and off the chart.

Visualize Performance of Participant Groups
In this step we will modify the chart to compare the CD4 levels for different treatment groups.
- Click Chart Layout in the upper right.
- Under Subject Selection, choose Participant Groups.
- Click Apply.
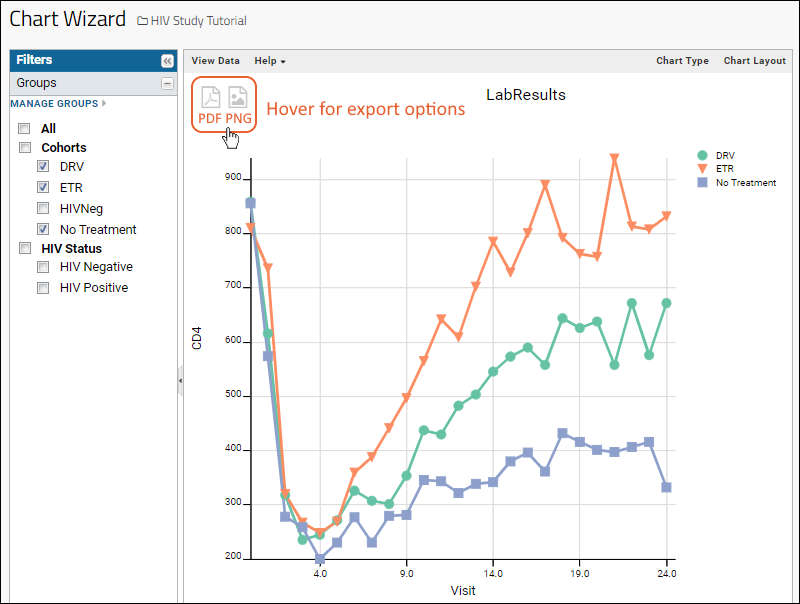
- You now have a chart comparing the mean CD4+ levels of the different treatment groups over time.
- The filters panel now shows checkboxes for participant groups defined in the study.
- Only groups checked will be shown in the chart allowing you to filter the time chart in various useful ways.
- Hover in the upper-left for export options. You can export the chart image in PDF or PNG formats.

Congratulations
You have now completed the walkthrough of LabKey tools for longitudinal studies. Next, you can explore creating a study from scratch in this tutorial:


