Various metrics can be used to track quality and investigate trends in different types of data. Using guide sets with
QC Trend Reports helps you build expected value ranges into your QC reports.
Add Guide Sets to QC Trend Reports
For each combination of graph parameters, you can define guide sets for tracking performance over time. To define a guide set, click
Create New. Guide sets are defined based on specified values per metric (i.e. mean and standard deviation). You specify the start date. If there is an existing guide set with a start date earlier than the one you provide for the new set, the end date of the old set will be set accordingly.

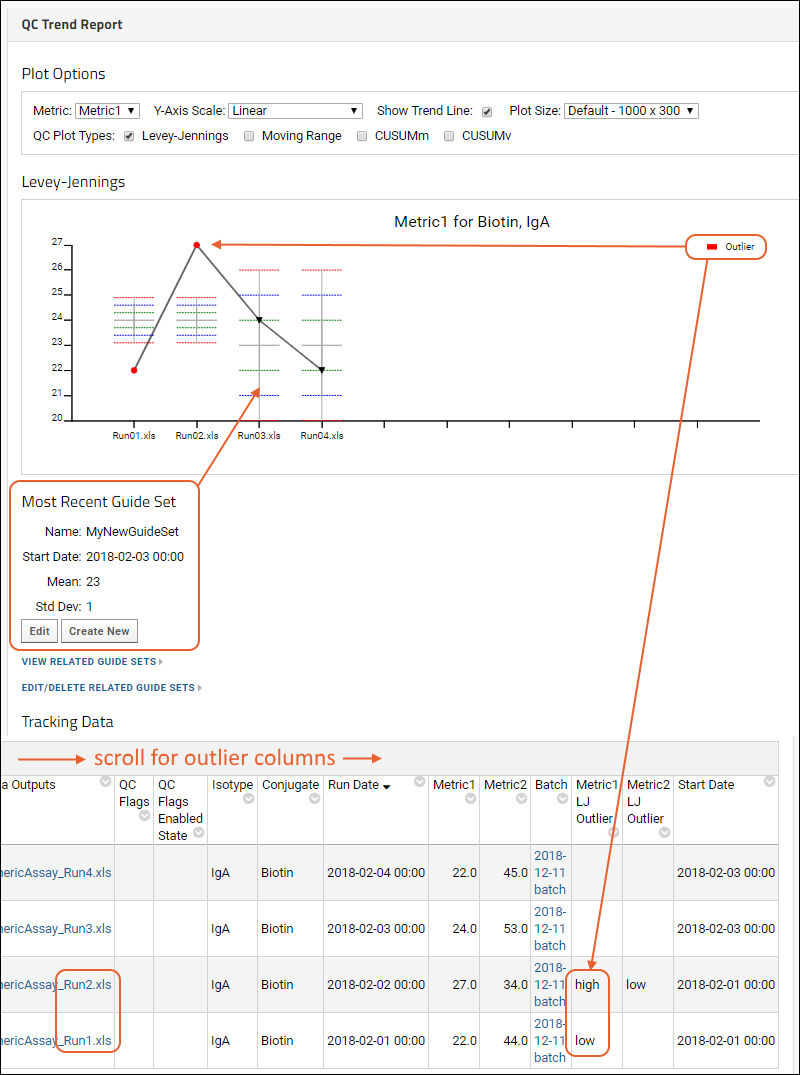
Guide sets are displayed in the QC Trend Report graph as bar lines: the center is the mean, and 3 standard deviations above and below are marked. Any outliers are shown with a colored highlight and listed under
Tracking Data as outliers for the specific metric/run combination.
There can be
more than one guide set defined and in use simultaneously. Shown above, there are two: a previous set applied to Run01 and Run02, and the most recent guide set which is applied to runs 3 and 4. Outliers are shown in red and at the far right of the
Tracking Data column, there are columns indicating these outliers for each metric. Notice that whether a point is an outlier or not is determined based on the guide set applied to that run, not necessarily the most recent guide set. In the above illustration, the point for run01.xls would not be an outlier under the most recent guide set, but is under the earlier guide set which is applied to run1.
Edit Guide Sets
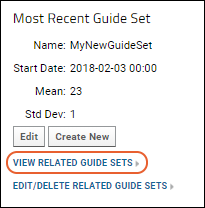
You can edit the most recently defined guide set, which is identified under the plot area, directly from the user interface by clicking
Edit.
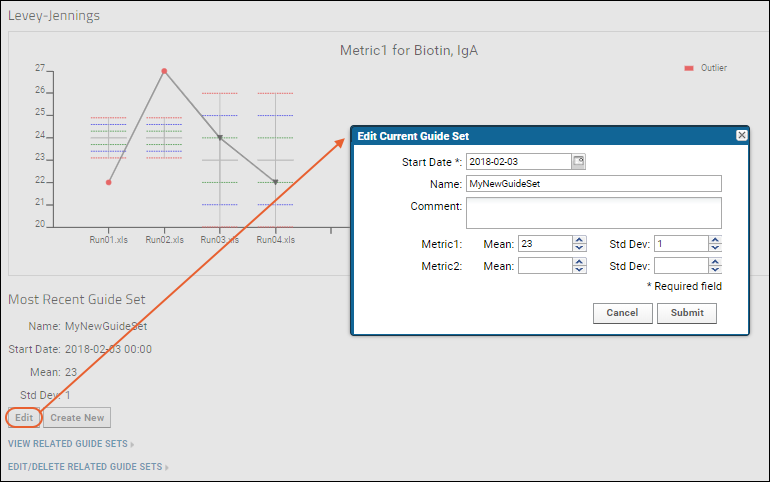
The interface is the same as for new guide set creation: Change or enter the desired values in the
Mean and Std Dev boxes, then click
Submit to save your changes.
To edit any other guide sets, click
Edit/Delete Related Guide Sets. This page will open in a new browser tab (allowing you to return to the report itself without reentering the parameters.
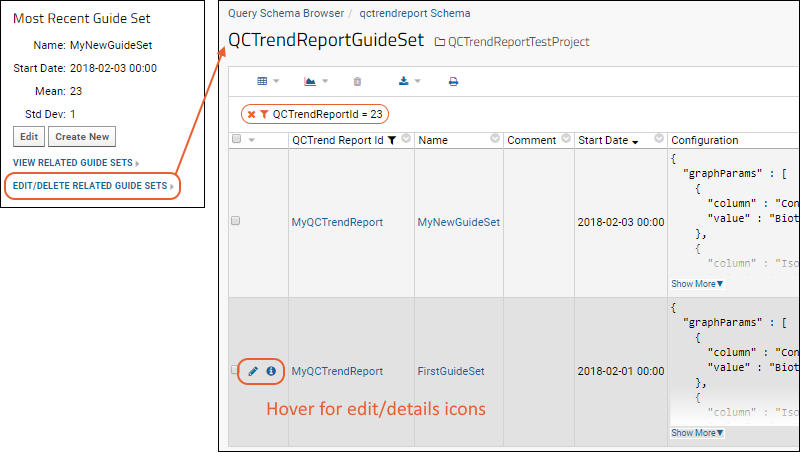
Hover over the row of interest to expose the icons, then click the
(pencil) icon to edit that guide set. The format for editing older guide sets is less graphical, but by modifying the JSON in the
Configuration field, you can still make the same changes to the
Mean and Std Dev settings for the metrics.
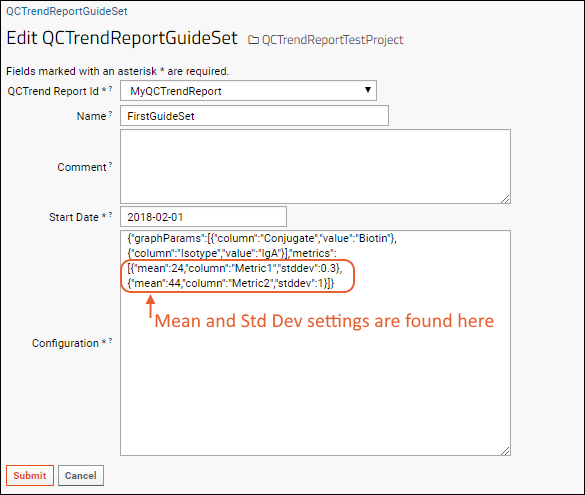
Click
Submit to save your changes. Reopen to the report to view the newly changed guide set.
Delete Guide Sets
To delete a guide set, click
Edit/Delete Related Guide Sets to open the list. Select the row to delete and click the
(delete) icon. Deleting a guide set cannot be undone.
View Multiple Guide Sets
When more than one guide set is defined, you can review them by clicking the link
View Related Guide Sets under the plot.
The guide sets are listed with start dates, and end dates if applicable, as well as the mean and standard deviation settings for each metric.

Related Topics
 Hover over the row of interest to expose the icons, then click the (pencil) icon to edit that guide set. The format for editing older guide sets is less graphical, but by modifying the JSON in the Configuration field, you can still make the same changes to the Mean and Std Dev settings for the metrics.
 The guide sets are listed with start dates, and end dates if applicable, as well as the mean and standard deviation settings for each metric.