This topic shows you how to create an application providing master-detail page views of some study data. Adapt elements from this sample to create your own similar data dashboard utilities. You must have
a developer role to complete these steps, generally on your own
local development server.
To get started, create a new study folder and import this folder archive:
This archive contains a sample study with extra wikis containing our examples; find them on the
Overview tab.

Participant Details View
On the
Overview tab of the imported study, click
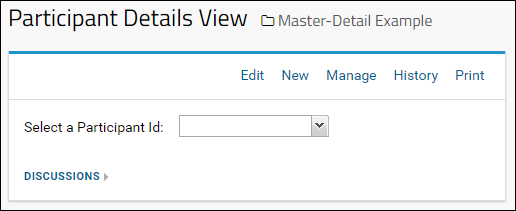
Participant Details View. This wiki displays an Ext4 combo box, into which all the participant IDs from the demographics dataset have been loaded.

Use the dropdown to
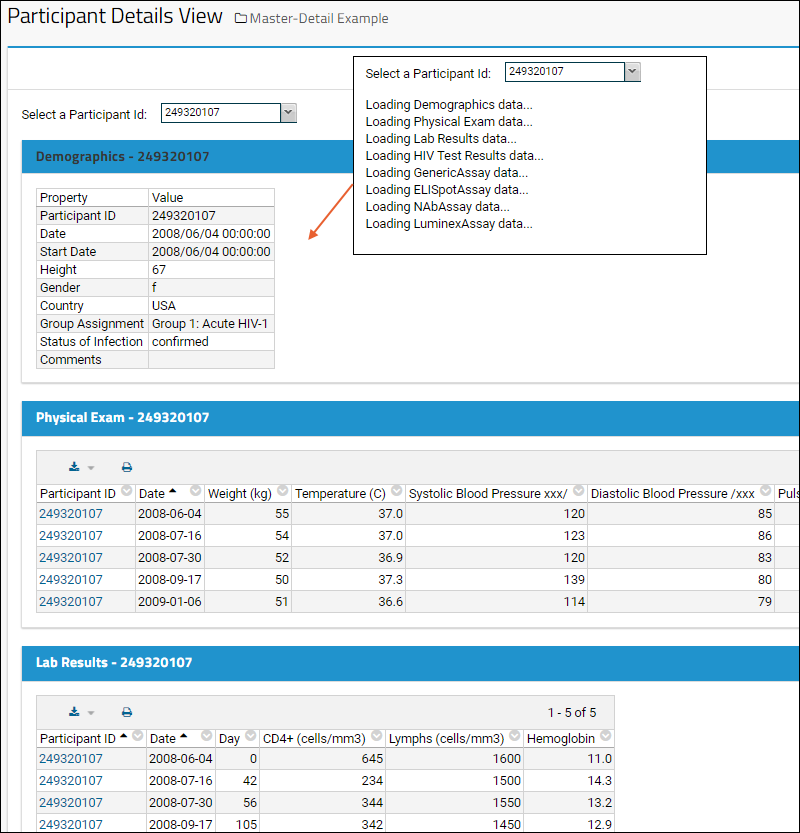
Select a Participant Id. Upon selection, the wiki loads the demographics data as well as several LABKEY.QueryWebParts for various datasets filtered to that selected participant ID.

Review the source for this wiki to see how this is accomplished. You can edit the wiki directly if you uploaded the example archive, or download the source here:
Participant Grid View
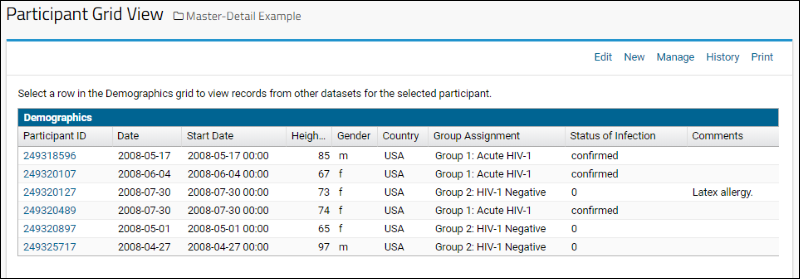
The "Participant Grid View" is a Master-Detail page using Ext4 grid panels (LABKEY.Ext4.GridPanel). It loads the demographics dataset and awaits click of a row to load details.
Note that if you click the actual participant ID, it is already a link to another participant view in the folder, so click elsewhere in the row to activate this master-detail view.
After clicking any non-link portion of the row, you will see a set of other datasets filtered for that participant ID as Ext4 grids.

Review the source for this wiki to see how this is accomplished. You can edit the wiki directly if you uploaded the example archive, or download the source here: