The CAVD DataSpace (CDS) data portal is a custom project developed by LabKey and the Statistical Center for HIV/ AIDS Research and Prevention (SCHARP) at the Fred Hutchinson Cancer Research Center (Fred Hutch). The goal is to help researchers gain new insights from completed studies, making integrated data from all studies available within a web-based interface for browsing. Learn more about this project and how to create an account for browsing in this topic:
Collaborative DataSpace: User Guide
in the DataSpace application offers a way to filter participants in studies based on attributes that span studies.
Click the
Find Subjects menu on the right or from the home page, you can also click on the circle for "Find a cohort" to reach this page. You will be able to filter using multiple attributes and discover relationships. Once applied, active filters will be shown in the right hand panel, along with the count of subjects, species, etc, which match the active filters.

Note that you will only see information and counts for subjects from studies to which you have data access. Different users may have been granted different access to underlying data and see different counts or membership in saved groups.
Finding Subjects
Click a link to open a filter panel for the given attribute. For example, if you click "study types" next to "by Studies" you would see something like this:
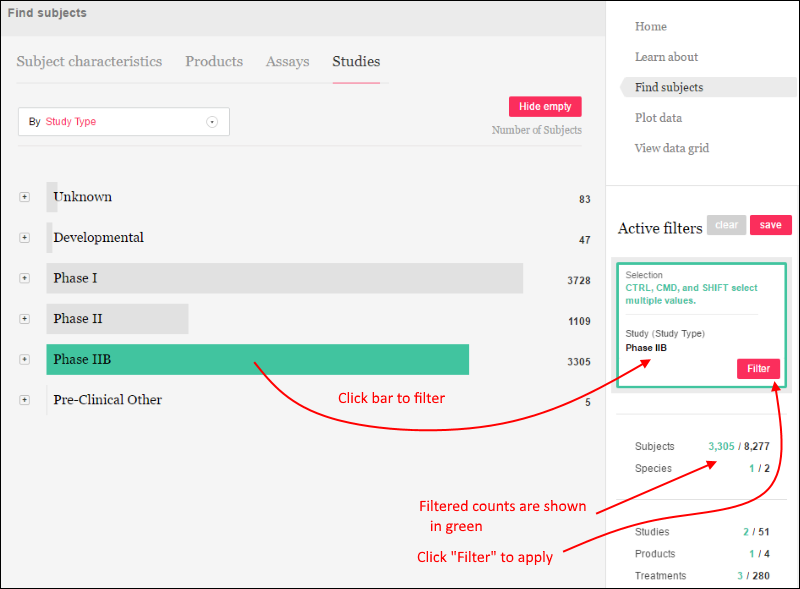
For each value of the attribute, in this case "study type" or phase, the size of the bar is proportional to the number of matching subjects, with a count shown to the right. You could, for example, narrow your view of the DataSpace to show only subjects from phase IIB studies by clicking that bar as shown below. Notice the filtered counts at the bottom of the right panel are shown in green, compared with the prior "base" number of subjects shown in black. You can multi-select additional bars within this attribute using control/cmd/shift keys.
Click
Filter to apply the filter, which will update the "base" number of subjects. Notice that with the filter applied, the other bars disappear for this attribute. You can hide the empty rows by clicking
Hide empty.

To apply a second filter, select another pulldown option or click another filtering category. When viewing the new attribute, only bars/counts for subjects from Phase IIB trials will be shown. Click a bar and click
Filter in the same way as you added the first filter.
When you add a second filter (the example shown here selected "ICS" studies from "Assays"), by default only subjects related to
all filters will be shown, i.e. filter1 matches "AND" filter2 matches. Click the filter box and use radio buttons to switch between AND and OR for multiple filters.
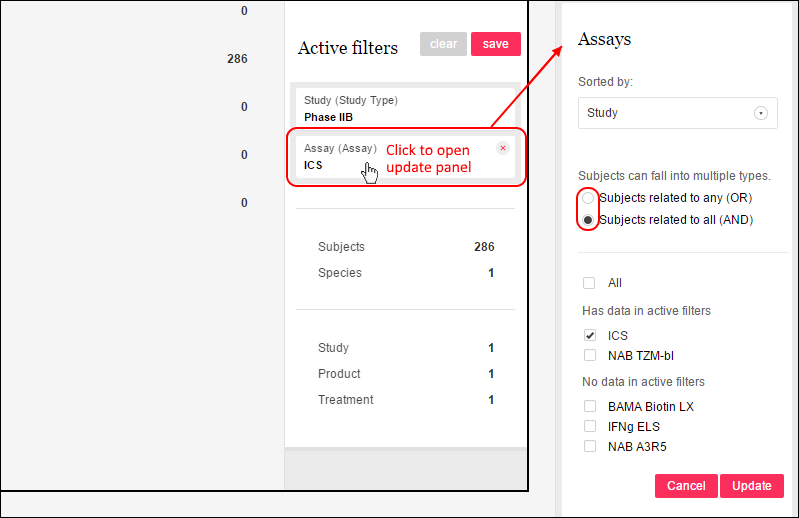
In the update panel, you can also use the checkbox UI to change which subjects are included; checking "All" in this panel will remove the filter entirely. You may also notice when hovering over an active filter box, there is an 'X' in the corner for removing it. When you remove a filter by either means, you will be offered an "Undo" link if you made a mistake and want to reactivate it.
Available Attributes for Filtering
- by Subject Characteristics
- Race
- Sex at birth
- Age
- Hispanic or Lation origin
- Country at enrollment
- Species
- Circumcised at enrollment
- BMI category
- Gender identity
- Study cohort
- by Products
- Name
- Product Type
- Developer
- Product Class
- by Assays
- Assay Type
- Study
- Immunogenicity Type
- Labs
- by Studies
- Treatment Summary
- Treatment Arm Coded Label
- Study type (phase)
- Network
- PI (principal investigator)
- Strategy
Save and Share Groups
Once you have created a set of filters and established a subset of interest, you can click
Save next to "Active filters" to save the group. Note that you are not strictly saving a "group" of participants, you are saving a named set of filters that show you that group.
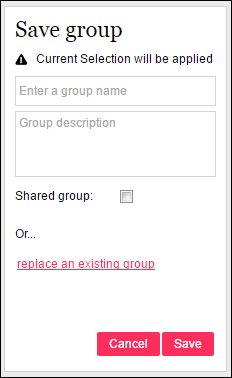
Click "replace an existing group" to see a list of groups you may want to replace with this new group.
Check the "Shared group:" box to make the group available to others. Remember that you are sharing a set of filters that show you the population of interest. Another user viewing the shared 'group' may see different counts or members if they have different access to subject dat within studies.
Administrators may choose to curate a set of shared groups for their users' convenience. When there are both shared and private groups within the application, they are shown in separate lists to make the distinction clear. The list of groups available appears in the lower left of the home page. Click on a group name to activate that set of filters.
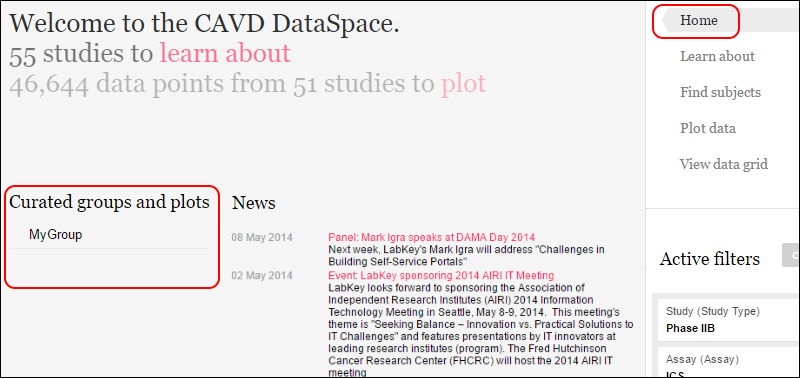
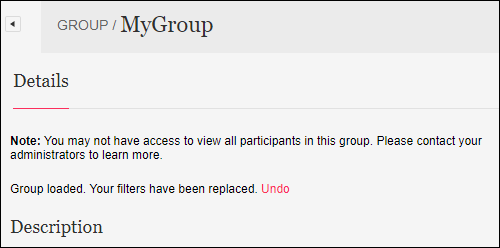
When you click a group name, you will see a Details page with additional information about the filters loaded. If you do not have permission to access data in all studies, you will see a note on this page. To leave the "group", i.e. remove the filters that the group consists of, click
Undo on the details page.
A saved group can also include a saved plot, making it a useful resource for sharing interesting data with others. In the same way that only data visible to the viewing user is shown, how the plot appears and what subset of data it presents may vary from user to user.
Related Topics