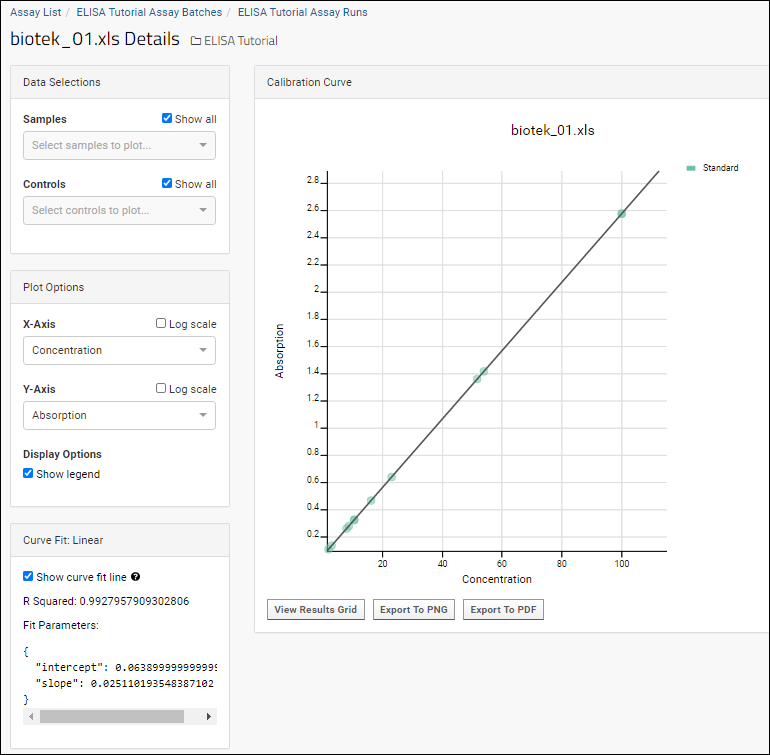
ELISA Run Details Plot
When you import ELISA Assay data, you can view
details for any run in an interactive visualization panel. By default, we display the standard curve plotted for concentration versus absorption (or raw signal). The calculated concentrations for the sample well groups are plotted as points around the standard curve. The curve is a linear least squares fit and we pass in the parameters of the curve fit (offset and slope).

For a single-plate, low-throughput assay run, you may not have additional selections to make among the following controls. Future development is planned to unlock more functionality in this area. Learn more in
Enhanced ELISA Assay Support.
Data Selections
In the
Data Selections panel, you can choose:
- Samples:
- Check the box to Show all Samples. (Default)
- Otherwise use the dropdown to select which Samples to plot.
- Controls:
- Check the box to Show all Controls. (Default)
- Otherwise use the dropdown to select which Controls to plot.
Plot Options
- X-Axis: The default is a Linear scale, check the box to switch to Log scale.
- Y-Axis: The default is a Linear scale, check the box to switch to Log scale.
- Display Options:
- Show legend: Checked by default. Uncheck to hide it.
Additional Metrics to Plot
For both axes, the set of metrics available include:
- Absorption
- Absorption CV
- Absorption Mean
- Concentration
- Concentration CV
- Concentration Mean
- Dilution
- Percent Recovery
- Percent Recovery Mean
- Std Concentration
Curve Fit
- Show curve fit line: Checked by default. Uncheck to hide it.
- When checked, the panel will display the following for this curve fit:
- R Squared
- Fit Parameters: Parameters specific to the curve fit.
For
Linear curve fits, the
Fit Parameters are:
Calibration Curve
On the right, you'll see the plotted
Calibration Curve based on how you've set the above selectors.
Below the plot, you have three buttons:
- View Results Grid: View the results data for this run.
- Export to PNG: Export the current plot display as a PNG file.
- Export to PDF: Export the current plot display as a PDF file.
Related Topics