Plotly Dash is a widely used framework for visualizing scientific data. This topic includes a few example scripts to get you started using a proxy servlet, then expands to show you how to use Plotly Dash with LabKey data.
Set Up Python and Plotly Dash
Install Python3
Check the
API documentation to find out the current supported version of python. Download and install a supported version for your operating system from
the Python site. Include Python on your path (one of the options during installation) so that you will be able to run it from anywhere.
Documentation for setting up Python is available on GitHub:
If you're installing Python3 on a mac, you may want to use
Homebrew.
To test that the correct version of Python is active on your path, run this from the location where you will run your Python scripts:
Install Dash
Once Python is installed correctly, install the Plotly Dash package as follows:
The second example provided below also uses the pandas package:
On a Mac, you may have an older root version of python running. If the above commands fail, try using "pip3" instead of "pip".
Run Simple Example Apps
This topic includes two small example apps that use python to create interactive Dash visualizations with hard-coded data. We'll set up both, running on two separate ports, and show you how to access them from within LabKey.
app.py: Bar Chart
Download this example script:
Place it in a location from which you can run it. For instance, on a windows machine you might use C:\labkey\scripts\. Navigate to that location in a command prompt/console window.
Run the app:
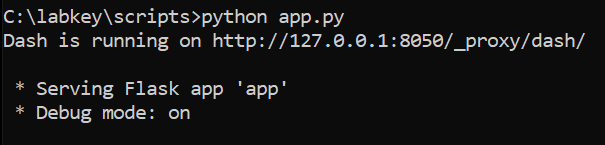
You will see output directing you to where this servlet is running, on
http://127.0.0.1:8050/_proxy/dash/.
- In the next section, we will set up a proxy servlet for this URL so that we can see it 'within' the server.
- When creating your own Python Plotly Dash app, you will need to make sure the 'routes_pathname_prefix' and the 'requests_pathname_prefix' for your Dash app follow this convention: '/_proxy/<proxy servlet name>/'. This proxy servlet name will be used again when setting up the proxy servlet so keep it on hand.
You may see only a "Loading..." message instead of the plot at either the proxy servlet address or the address in your python script ('http://127.0.0.1:8050/_proxy/dash/' for accessing the app.py chart) if you do not correctly specify the 'routes_pathname_prefix' and the 'requests_pathname_prefix'. You may also see the "Loading..." message at the proxy servlet address if
the proxy servlet has not been set up yet or is misconfigured.
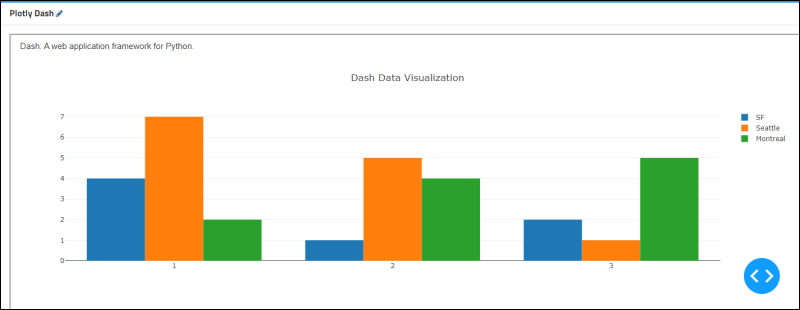
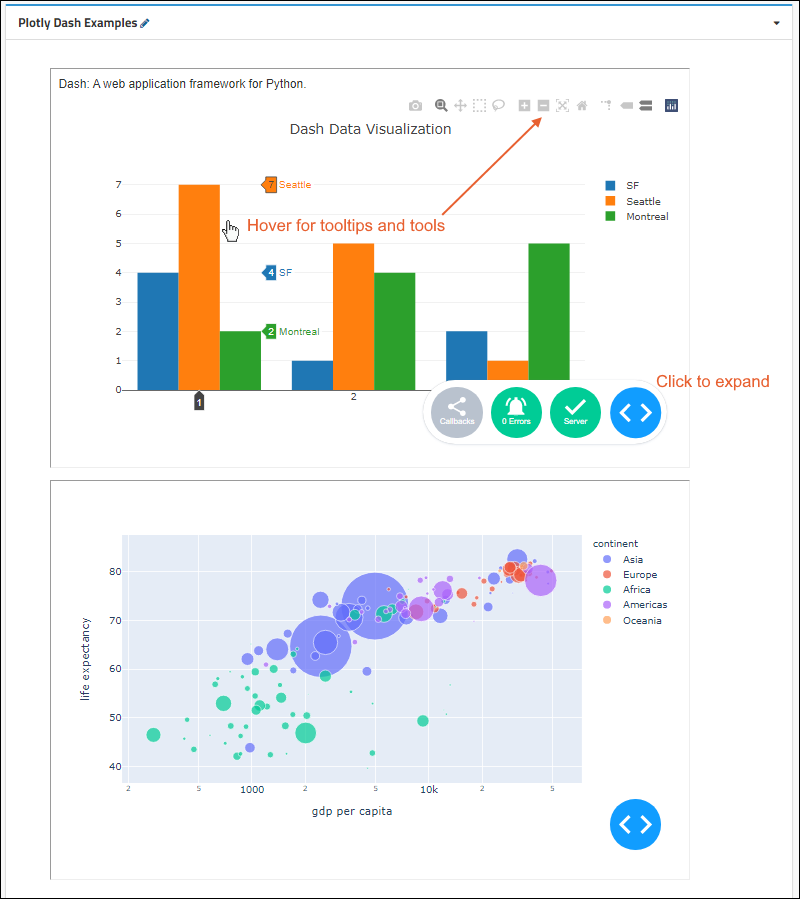
This script generates a bar chart using some simple hard coded values and will look similar to:
Review the app.py Script
Open the app.py script in a text editor and review the contents.
- The script defines an "app", applying a stylesheet.
- In app.config.update, a path prefix is applied so that paths will be relative to LabKey's proxy server path. Learn more here.
- Next, the script defines the "layout".
- Plotly Dash will call app.layout when rendering the request.
app2.py: Scatter Plot
Download this example script and place it in the same location as the first script:
Open a
new command prompt window, so that app.py continues to run in the first window. Navigate to the script location and run this second app:
Again, you will see the URL where this app is running (
http://127.0.0.1:8050/_proxy/dash2/ for app2.py), but you will be unable to see the app embedded on your server or through a proxy servlet
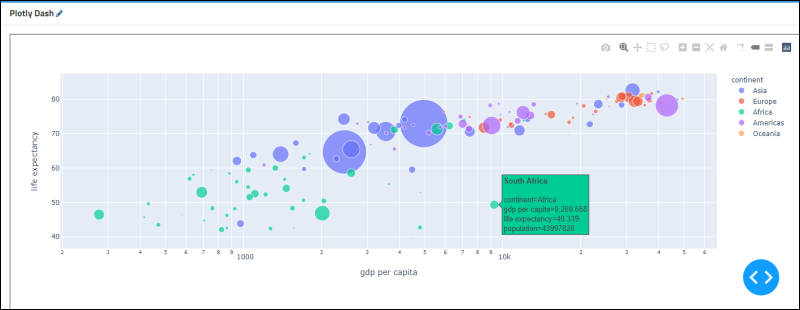
until we set up another proxy servlet for this URL. This app uses public demo data to generate a scatter plot similar to:
You can also review the app2.py script in a text editor to see how it is similar to the first example.
Configure Proxy Servlets
Next, we'll configure LabKey Server to provide access to these two apps and show you how you might display the visualizations for users.
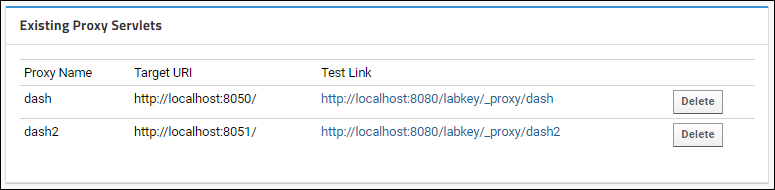
Follow the guidance in the topic below to create two proxy servlets for the following two examples. One named "dash" pointed at
http://localhost:8050/_proxy/dash/ and one named "dash2" pointed at
http://localhost:8051/_proxy/dash2/
Include Plotly Dash Examples in a Wiki
The simplest way to include your examples in a wiki on LabKey Server is to place them in a wiki using iframe.
First, make sure that both your apps are running in separate command windows on the two ports. On your LabKey Server:
- You can use the servlets anywhere on the server, but for demonstration purposes, let's make a separate workspace:
- Log in to your server and navigate to your "Tutorials" project. Create it if necessary.
- Create a new subfolder named "Plotly Dash Demo". Accept all defaults.
- In the Wiki panel, click Create a new wiki page to display in this web part.
- Name the page "dashDemo" (or any name you choose).
- Enter the Title: "Plotly Dash Examples" (or any name you like)
- Click Convert to... and convert the page format to HTML if necessary.
- On the Source tab, paste this content:
<iframe src="http://localhost:8080/_proxy/dash" width=800 height=500/>
<p />
<iframe src="http://localhost:8080/_proxy/dash2" width=800 height=500/>
- Click Save & Close.
You now have two Plotly Dash apps running, both accessible in this wiki. Hover to reveal tooltips and tools for exploring Plotly Dash features.
Extend the Example
You can extend our simple example apps in many ways using all the features of Plotly Dash. Change the plotting examples to use your own data and use other visualization styles. Learn more in the Plotly Dash documentation
here.
You can also enhance how you use the app on the LabKey Server side. For example, if you want to extract the current container, and include that in the iframe path (after /dash or /dash2) you could revise your wiki to read:
<iframe id="dashFrame" width=800 height=500/>
<p />
<iframe id="dashFrame2" width=800 height=500/>

<script>
    var src = "http://localhost:8080/labkey/_proxy/dash";
    src = src + "?container=" + encodeURIComponent(LABKEY.container.path);
    document.getElementById("dashFrame").src = src;
</script>
<script>
    var src = "http://localhost:8080/labkey/_proxy/dash2";
    src = src + "?container=" + encodeURIComponent(LABKEY.container.path);
    document.getElementById("dashFrame2").src = src;
</script>
Users can grab the container value in a python script with the following added to the layout function:
request.args.get("container")For example, a single Plotly Dash visualization could be created to render data from any container in which it was run, or you could add other arguments to that query string, such as the schema and query. In the following example, we hard code these variables to give you a starting place for more development.
Use Plotly Dash with LabKey Data
By extracting user credential information (i.e. an
API key) from the request header, you can develop Plotly Dash applications that securely act on data stored in LabKey Server.
Before completing this section, review the Plotly Dash documentation
here to give you an understanding of how to build and use the app.layout demonstrated below.
Prerequisites
- First configure and test the proxy servlet and ability to connect to Plotly Dash using the above simple examples.
- Install an example study including a "Demographics" dataset. To minimize editing of our example script, use a localhost dev machine and follow this topic to install our study in the "/Tutorials/HIV Study" folder.
- Confirm that you have version 2 of the python API. If you are not sure, run:
pip install --upgrade labkey
Download and Run the New Script
Download this script to the same location where you placed the app.py script.
In the command window where you are currently running app.py, stop it (ctrl-C). Now run the new script in that same command window:
Check Results
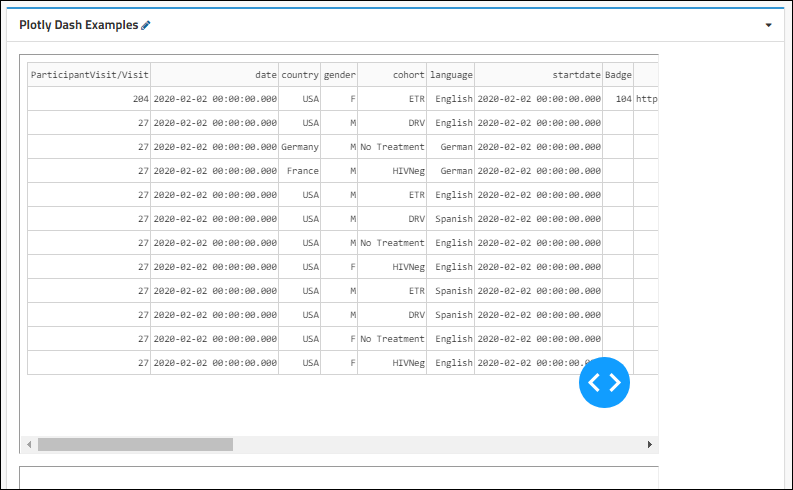
Return to the wiki you created for the examples above, and notice that now the first example has been replaced with our new data frame loaded from the study you installed. (If you left app2.py also running, you will see it in the wiki as well, if not, you will see an exception report where the wiki is still trying to locate an app running on the /dash2 servlet.)
Review server.py: LabKey Dash Table Example
The server.py script can serve as a starting place to specify other container paths, schemas, queries and develop visualizations in Plotly based on the data frame you load.
#
# Copyright (c) 2015-2021 LabKey Corporation
#
# Licensed under the Apache License, Version 2.0 (the "License");
# you may not use this file except in compliance with the License.
# You may obtain a copy of the License at
#
#     http://www.apache.org/licenses/LICENSE-2.0
#
# Unless required by applicable law or agreed to in writing, software
# distributed under the License is distributed on an "AS IS" BASIS,
# WITHOUT WARRANTIES OR CONDITIONS OF ANY KIND, either express or implied.
# See the License for the specific language governing permissions and
# limitations under the License.
#

# ********************************
# This example demonstrates rendering a Dash Table via a LabKey Proxy Servlet.
# Prerequisites:
# 1. Proxy servlet named "dash"
# 2. Adjust container path, schema and table below
# Note: This example will not run using the default Dash
# development server URL. Instead, log into LabKey and
# navigate via the Proxy you set up (prerequisite #1) e.g.
# http://localhost:8080/labkey/_proxy/dash.

import dash
import dash_html_components as html
import dash_table

import pandas as pd
from labkey.api_wrapper import APIWrapper
from flask import request
from labkey.exceptions import RequestError

# Header passed by LabKey Server containing the API Key for the user making the request
API_KEY = "X-Lkproxy-Apikey"

# This depends on server configuration, it is commonly "labkey" on a dev machine
# and "None" on a cloud or production server. If you are unsure of the value
# contact your administrator.
CONTEXT_PATH = "labkey"
# The domain name your LabKey server is running on
DOMAIN = "localhost:8080"
# Set to True if your server is using HTTPS
USE_SSL = False

CONTAINER_PATH = "Tutorials/HIV Study"
SCHEMA = "study"
QUERY = "Demographics"

# Add a serve_layout method. This will be added to the app variable below in
# (app.layout = serve_layout) and Dash will call app.layout when rendering the request.
def serve_layout():
    # Dash doesn't always call serve_layout within a request context, so we need to check
    if request:
        api_key = request.headers.get(API_KEY)

        # If the user accesses dash directly we won't have the labkey headers
        if api_key:
            api = APIWrapper(
                DOMAIN,
                CONTAINER_PATH,
                context_path=CONTEXT_PATH,
                use_ssl=USE_SSL,
                api_key=api_key,
                # CSRF not needed when using API keys
                disable_csrf=True,
            )
            result = api.query.select_rows(SCHEMA, QUERY)
            df = pd.DataFrame(result["rows"])

            return html.Div(
                children=[
                    dash_table.DataTable(
                        id="datatable-paging",
                        columns=[{"name": i, "id": i} for i in df.columns],
                        data=df.to_dict("records"),
                    )
                ]
            )

    # Not a proxied call, serve a default layout
    return html.Div(children=[html.Div(children="LabKey Dash Table Example")])


pd.options.display.float_format = "{:,.2f}".format
external_stylesheets = ["https://codepen.io/chriddyp/pen/bWLwgP.css"]
app = dash.Dash(name, external_stylesheets=external_stylesheets)

# Update Dash config so it generates paths relative to LabKey's proxy server path
app.config.update(
    {
        "routes_pathname_prefix": "/_proxy/dash/",
        "requests_pathname_prefix": "/_proxy/dash/",
    }
)

app.layout = serve_layout
port = 8050

if name == "main":
    app.run_server(debug=True, port=port)
Related Topics

