Annotations can be added to Panorama QC plots to assist in quality control. Marking a specific event can help identify causes of changes. If there are replicate annotations present in the imported Skyline data file, they will also be shown and can be used to filter plots.
Quality Control Annotations
Color coded
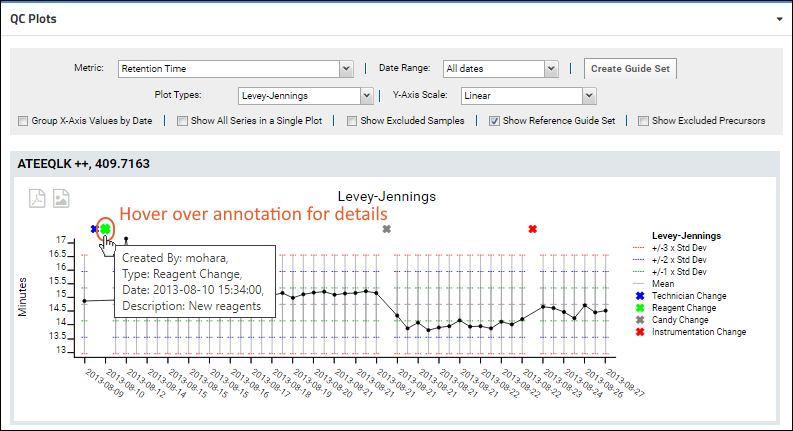
markers can be used to annotate the QC plots with information about the timing of various changes. The annotated plot will show colored Xs noting the time there was a change in instrumentation, reagent, etc. The legend shows which color corresponds to which type of annotation.
Hovering over an annotation pops up a tooltip showing information about when the annotation event occurred, the description of the event, and who added it.

Add Annotations
Select the
Annotations tab to define and use annotations.

Define Types of Annotations
Each type of annotation has a name, description, and color to use. There are three built-in categories which are shared by all Panorama folders on the server. You may change them or the colors they use, but be aware that other projects may be impacted by your changes. Annotation Types defined in the "Shared" project are available throughout the server. Types defined at the project level are available in all subfolders.
- Instrumentation Change
- Reagent Change
- Technician Change
You can also define your own annotation types as required. For example, you might want to note changes to environment like addition of building HVAC or power outages. Our example above shows a "Candy Change" illustrating that you can decide what you think is worth noting.
If you wish to
Add new categories of annotations, use
(Insert data) > Insert New Row in the
QC Annotation Types section.
To
Edit existing annotation types, hover over the row and click the
(Edit) icon that will appear in the leftmost column.
Add New Annotations to Plots
To enter a new annotation, use
(Insert data) > Insert New Row in the
QC Annotations section. Select the type of event (such as Reagent Change), enter a description to show in hover text ("new batch of reagent"), and enter when it occurred. Dates that include a time of day should be of the form "2013-8-21 7:00", but a simple date is sufficient. Return to the
Panorama Dashboard tab to view the plots with your new annotation applied.
The annotation symbol is placed on the x-axis above the tick mark for the date on which the event occurred. If there are multiple tickmarks for that date, the annotation will appear above the leftmost one. If an annotation occurred on a date for which there is no other data, a new tick mark will be added to the x-axis for that date.
Replicate Annotations
If the Skyline document included replicate annotations, you will see them listed in the
ReplicateAnnotation panel at the bottom of the page. To learn about filtering QC plots using replicate annotation information, see
this topic
Related Topics
