When administrators add charts or other visualizations in LabKey Server, they are surfaced above the corresponding data grid in the LabKey LIMS and Biologics applications.
Add a Chart
To add a chart:
- Choose Create Chart from the Charts menu above a grid.

- Select the type of chart by clicking the image along the left side of the modal.
- Enter a Name and select whether to:
- Make this chart available to all users
- Make this chart available in child folders
- Depending on the chart type, you will see selectors for X-axis, Y-axis, and various other settings needed for the chart. Required fields are marked with an asterisk.
- Once you have made selections, you will see a preview of the chart.

- Click Create Chart to save it.
Learn more about the options for the individual chart types in these topics:
View a Chart
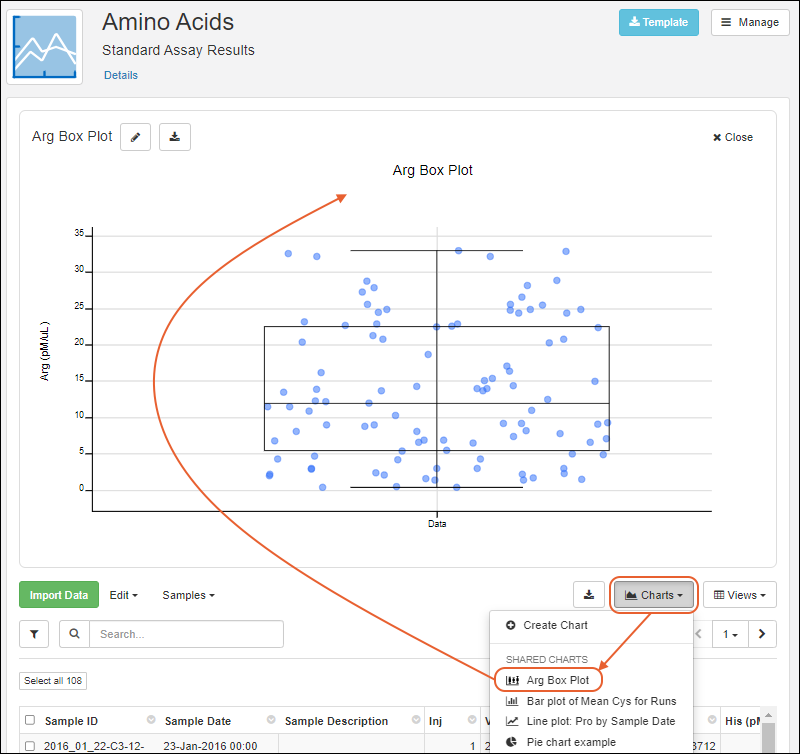
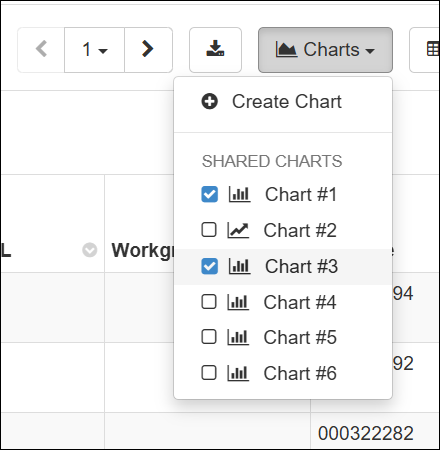
Any charts available on a data grid will be listed on the
Charts menu above the grid.
Selecting a chart will render it above the grid as shown here.

Select up to 5 charts for display.

Edit a Chart
To edit a chart, open it from the menu and click the
.

You'll see the same interface as when you created it and be able to make any adjustments. Click
Save Chart when finished.
You can also click to
Delete Chart from the edit panel.
Error Bars and Aggregation Methods
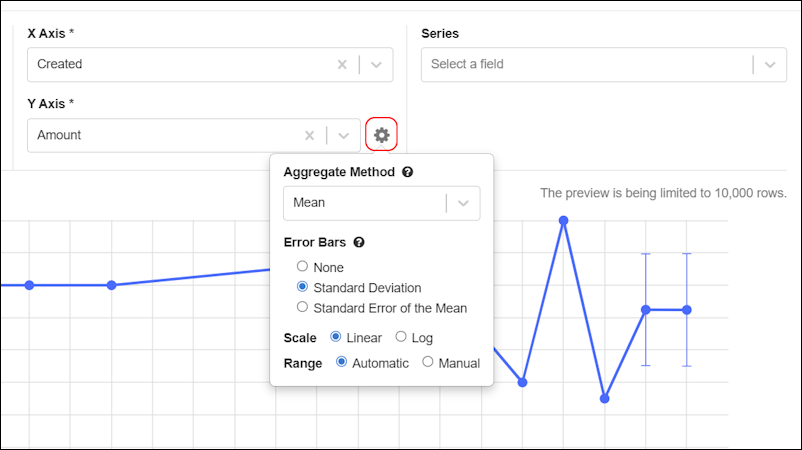
For Bar and Line charts, aggregation and error bar options are available by clicking the Y-axis gear icon.

When the aggregation method is set to Mean, then the options for error bars are shown: None, Standard Deviation, Standard Error of the Mean.
Export a Chart as PDF or PNG
Click the
(Download) button to choose either PNG or PDF format for your export.

Related Topics

 When the aggregation method is set to Mean, then the options for error bars are shown: None, Standard Deviation, Standard Error of the Mean.