The CAVD DataSpace (CDS) data portal is a custom project developed by LabKey and the Statistical Center for HIV/ AIDS Research and Prevention (SCHARP) at the Fred Hutchinson Cancer Research Center (Fred Hutch). The goal is to help researchers gain new insights from completed studies, making integrated data from all studies available within a web-based interface for browsing. Learn more about this project and how to create an account for browsing in this topic:
Collaborative DataSpace: User Guide
Monoclonal antibodies (mAbs) are typically sourced in part from an animal (or human) that has been challenged with an antigen, the process of creating mAbs includes fusing these cells with additional myeloma cells. This makes them different from antibodies taken directly from a subject, such as via a sera sample. MAbs are considered distinct from that initial test subject. A particular cell line may also be tested more than once, sometimes after significant time has passed and the mAbs are now generations removed from the initial parent cell(s). The usual process of filtering by subject characteristics is not applicable to this type of data in a DataSpace.
There are two areas where data derived from assaying monoclonal antibodies (mAbs) can be incorporated into and viewed in the DataSpace application: on the "Learn About" page with other assays, and on a separate tab.
Monoclonal Antibodies Tab
When the DataSpace contains MAb Assay data, click
Monoclonal Antibodies to see the grid.

The mAb summary grid aggregates statistics for all mAb assay records for each mAb and mixture containing a mAb. There are three categories of columns in the grid:
- Static Values: Values associated with the given mAb or mixture useful for filtering.
- Mab/Mixture: This column lists the single mAbs and mixtures containing those antibodies, making it possible to select for the various mixtures and solo preparations for a given antibody.
- Donor Species
- Isotype
- HXB2 Location
- Antibody Binding Type
- Count Columns: These columns show the count of unique values for the given mAb/mixture.
- Viruses
- Clades
- Tiers
- Studies
- Geometric Mean Columns:
- Curve IC50: The geometric mean of all IC50 values for matching mab/mixture records. Values of infinity/-infinity are excluded from the calculation. This value is computed using SQL exp(AVG(log(ic50))).
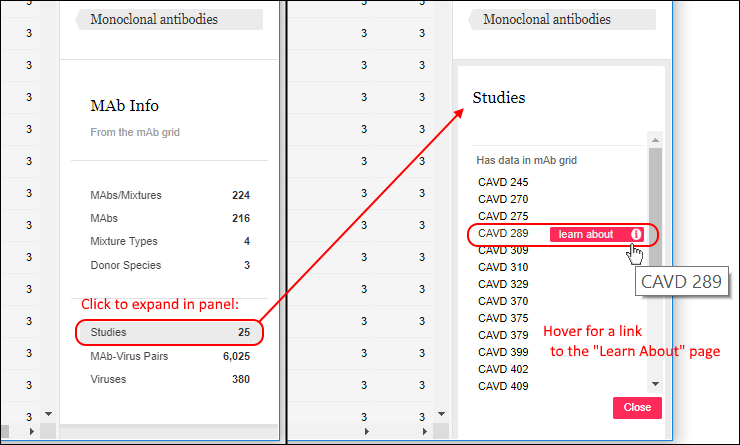
The filter panel area displayed in the right panel is similar to the filtering panel available in other parts of the DataSpace. Data is not aligned with subjects in the same way as other data, but can be filtered and will show the following:
- MAbs/Mixtures: The count of unique MAb/Mixture names ('mab_mix_name_std')
- MAbs: The count of unique MAb names ('mab_name_std')
- Mixture Types: The count of unique mixture types
- Donor Species: The count of unique donor species
- Studies: The count of unique 'prot' values, showing the study label.
- MAb-Virus Pairs: The count of unique 'mab_mix_name_std' and 'virus' combinations.
If you click any row in the filter panel, you will see an expanded list of the values comprising it. Shown below, the Studies list expands to a list of study names. Hover over any item to reveal a link to the learn about page for the study.
Learn more about filtering
below.
Filter MAb Data
Hover over any column of data to reveal the
(Filter) icon in the header. Click to set filters using checkboxes, or use the search box to narrow the list.

Filter Static Values
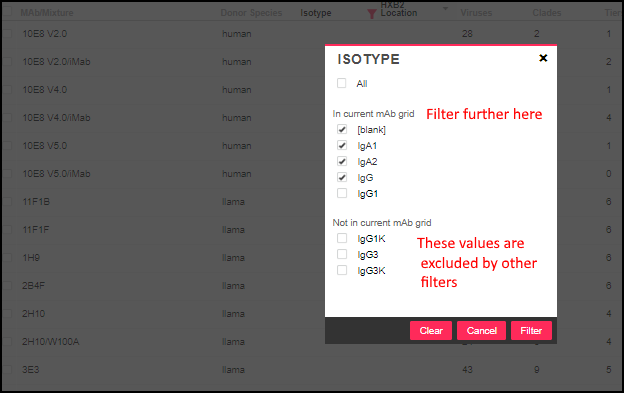
The static value columns (
MAb/Mixture, Donor Species, Isotype, HXB2 Location, Antibody Binding Type) offer two lists when there are values both in and out of the current selection. For example, filtering the isotype column might look like this:
Filtering Count Columns
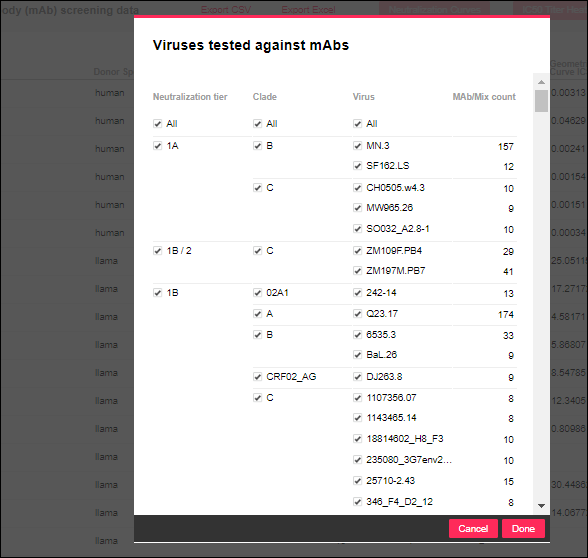
When you filter any one of the columns providing distinct count values, you see a panel for selecting among the other count column values simultaneously. For example, filtering the
Viruses column looks like this:
Filtering Calculated Columns including Geometric Mean
The geometric mean
Curve IC50 column filter offers a set of ranges of values as shown here:

MAb Filter Panel
After applying a few grid filters, you will notice that the filter panel on the right shows counts different from the original set of mAbs (inset on the left of this image):

Click
Clear in the MAb filter panel to restart filtering from the full set of mAbs available.
When you have selected the subset you want, you can click
Save to save this set of filters for finding this subset of mAbs. To learn more about saving groups, see the
documentation for saving subject filters. Note that MAb filter groups and Subject filter groups are saved independently. You can only replace a MAb group with another MAb group.
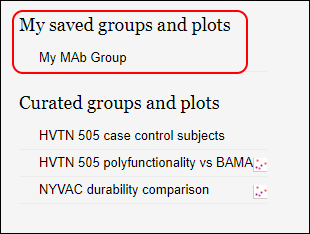
When you have saved groups, you will see them on the home page of the DataSpace above any publicly shared
Curated groups.
Export MAb Data
You can export unaggregated and filtered MAb data in either CSV format or Excel workbook format. Above the MAb Data grid, click either
Export CSV or
Export Excel.

Selecting rows prior to export is optional. If no rows are explicitly selected, all columns and rows are included in the export. If a subset of rows are selected, only data from these rows are included.
The Excel export includes the following sheets.
- Study and MAbs: A list of mAbs and their studies.
- MAbs: The characteristics of the mAbs included.
- NAB MAB: The MAb assay data.
- Metadata: Terms of use, export date, selected export options, filters and selections.
- Studies: The list of studies included in the export, with detailed information.
- Assays: The list of assays included in the export, with detailed information.
- Variable Definitions: NAB MAB assay columns included in the export.
In a CSV export, a zip file is downloaded including a CSV file for each of the above listed sheets,
except the Metadata sheet, which is downloaded as a metadata.txt file.
MAb R Reports
R reports for MAb data are created in LabKey (outside the DataSpace application). Up to 2 reports can be configured to show as buttons directly in above the Monoclonal antibodies grid.
Create MAb R Reports
An administrator or developer creates R reports for MAb data.
- The R reports can access the following parameters:
- labkey.url.params$"filteredKeysQuery" - the session query for filtered and selected unique keys
- labkey.url.params$"filteredDatasetQuery" - the session query for filtered and selected dataset
- R reports can query content directly from the queries param, or join to data from queries.
Example usage:
library(Rlabkey)
if (!is.null(labkey.url.params$"filteredKeysQuery"))  {
   	labkey.keysQuery <- labkey.url.params$"filteredKeysQuery"
   	cat('Query name for filtered unique keys: ', labkey.keysQuery)
   	uniquekeys <- labkey.selectRows(baseUrl=labkey.url.base, folderPath=labkey.url.path, schemaName="cds", queryName=labkey.keysQuery)

   	cat('nn', 'Number of unique keys: ', nrow(uniquekeys), 'nn')

	cat(length(names(uniquekeys)), 'Columns for unique keys:n')
	names(uniquekeys)
} else {
   print("Error: filteredKeysQuery param doesn't exist")
}

if (!is.null(labkey.url.params$"filteredDatasetQuery"))  {
   	labkey.datasetQuery <- labkey.url.params$"filteredDatasetQuery"
   	cat('Query name for filtered dataset: ', labkey.datasetQuery)
   	filtereddataset <- labkey.selectRows(baseUrl=labkey.url.base, folderPath=labkey.url.path, schemaName="cds", queryName=labkey.datasetQuery)

   	cat('nn', 'Number of filtered data rows: ', nrow(filtereddataset), 'nn')

	cat(length(names(filtereddataset)), 'Columns for dataset:n')
	names(filtereddataset)
} else {
   print("Error: filteredDatasetQuery param doesn't exist")
}
After creating your R Reports, notice the
reportId shown in the URL (%3A represents the : symbol). Shown here, the report ID is 35:

Reports must be saved as
Shared with all users to be available to DataSpace users.
Configure Displayed R Reports
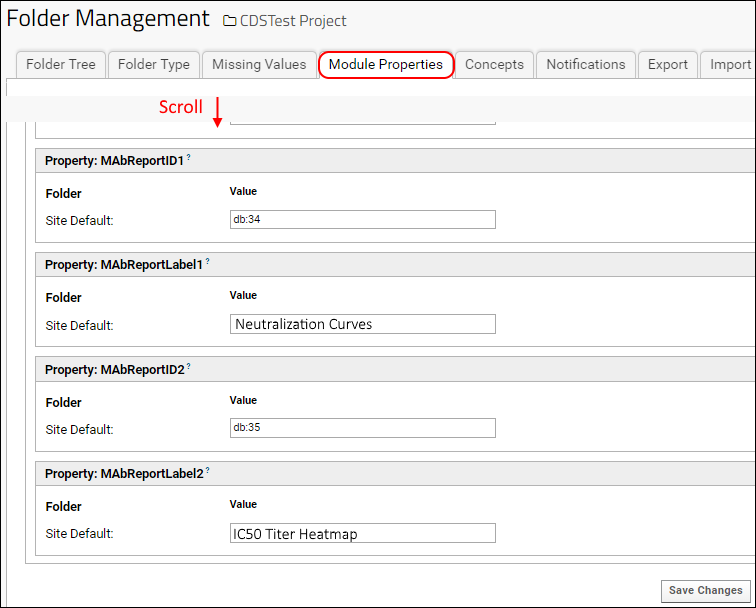
Using module properties, an admin configures up to two R reports to display as buttons above the MAb grid.
- Select > Folder > Management.
- Click the Module Properties tab.
- Scroll down to the MAbReport section.
- MAbReportID1 is the reportId for the first R report.
- MAbReportLabel1 is the display text for the button for the first R report. This label does not need to match the title displayed on the report itself.
- MAbReportID2 and MAbReportLabel2 identify and label the second report.
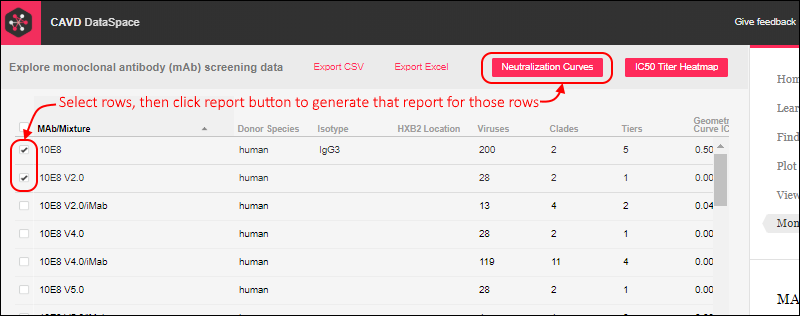
When you return to the DataSpace application, you will see buttons for the two reports shown above the grid on the
Monoclonal Antibodies tab. Use filtering as needed, then select the rows to plot. The box in the header is used to select all rows. Click one of the buttons to generate the report on the selected rows.
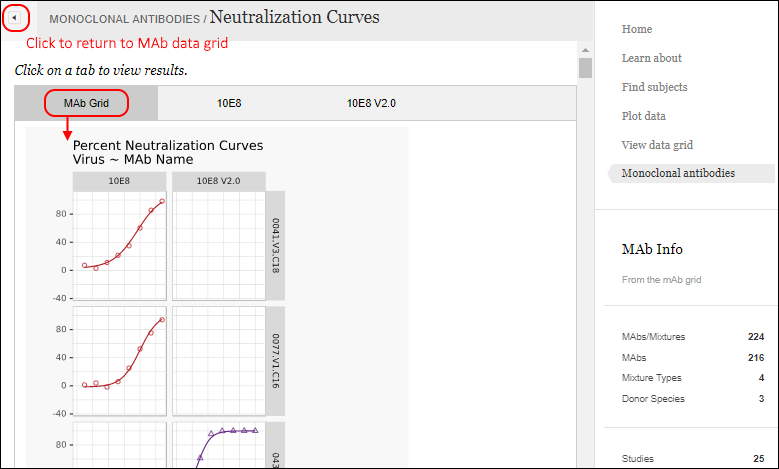
Viewing the report, click the
button to return to the grid. Within this report, there are multiple tabs to view.
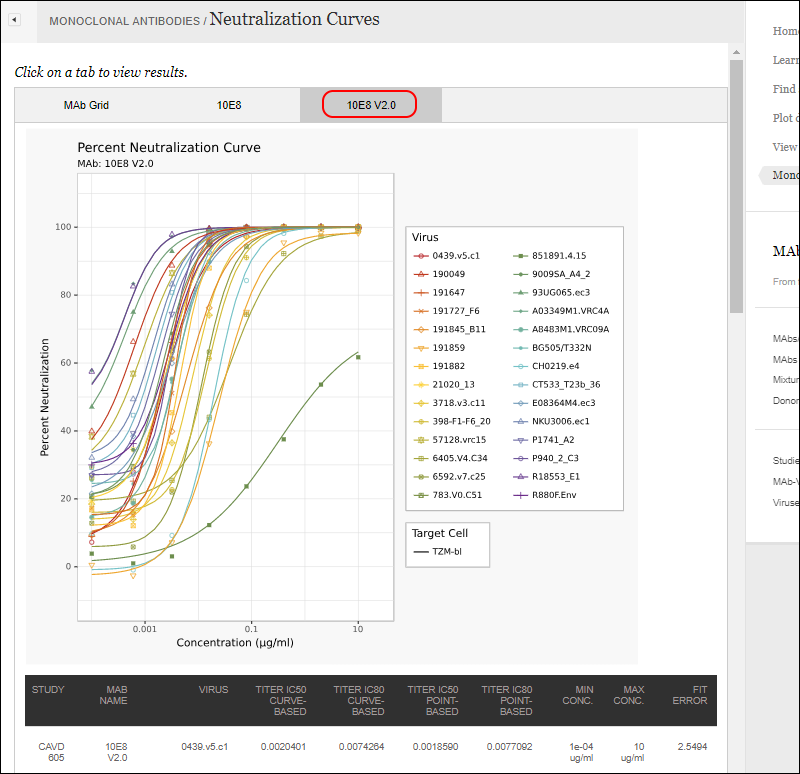
Another tab within the same report shows the curves for a specific MAb, with data in a grid below.
Plot Pharmacokinetic (PK) Data for MAbs
Pharmacokinetic (PK) data for mAbs can be plotted in the DataSpace using the
PK MAb assay and a "Study hours" time dimension. PK data is often gathered over short intervals after infusion of a patient.
To plot PK data:
View MAb Data on the Learn About Tab
On the
Learn About page, use the
MAbs tab to see details about the monoclonal antibodies included in the DataSpace.
You can also click the
Assays tab and scroll to see monoclonal antibody assay data that is available.
The summary page shows details about the data as shown for other assays on the
Learn About page.
Related Topics
 Selecting rows prior to export is optional. If no rows are explicitly selected, all columns and rows are included in the export. If a subset of rows are selected, only data from these rows are included.The Excel export includes the following sheets.