Panorama provides the following built-in reports:
Figures of Merit
The Figures of Merit report:
- For a given Skyline document, click the ## Calibration Curves link.
- In the Peptides Calibration Curves panel, click the peptide name (or hover for a link). Click either for details for that peptide.

Scroll below the
Calibration Curve on the details page to the
Figures of Merit panel. Summary information, including
LOD/LOQ Values, is shown here.
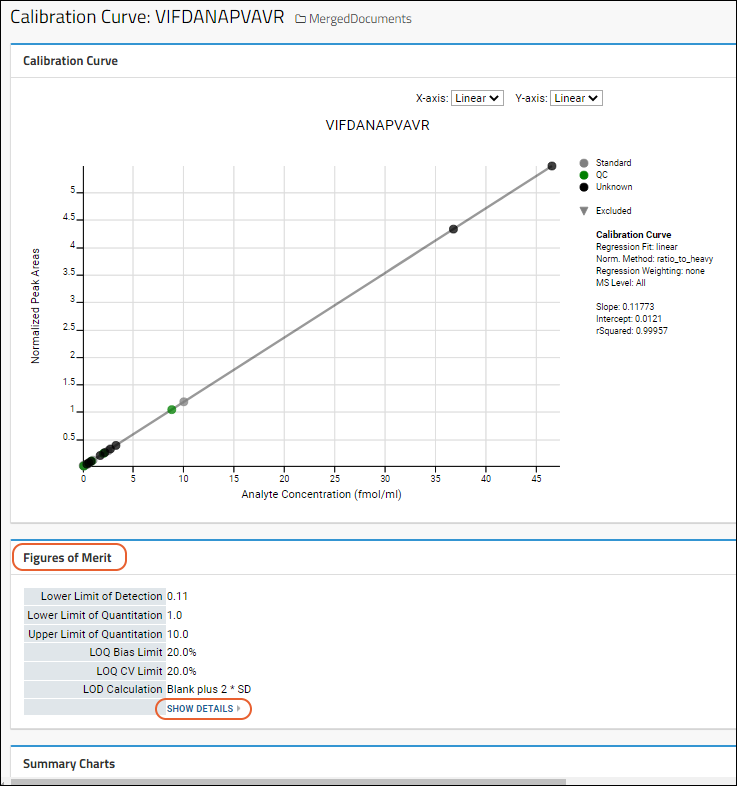
Click
Show Details for the more detailed report.
The
Figures of Merit report includes several sections.
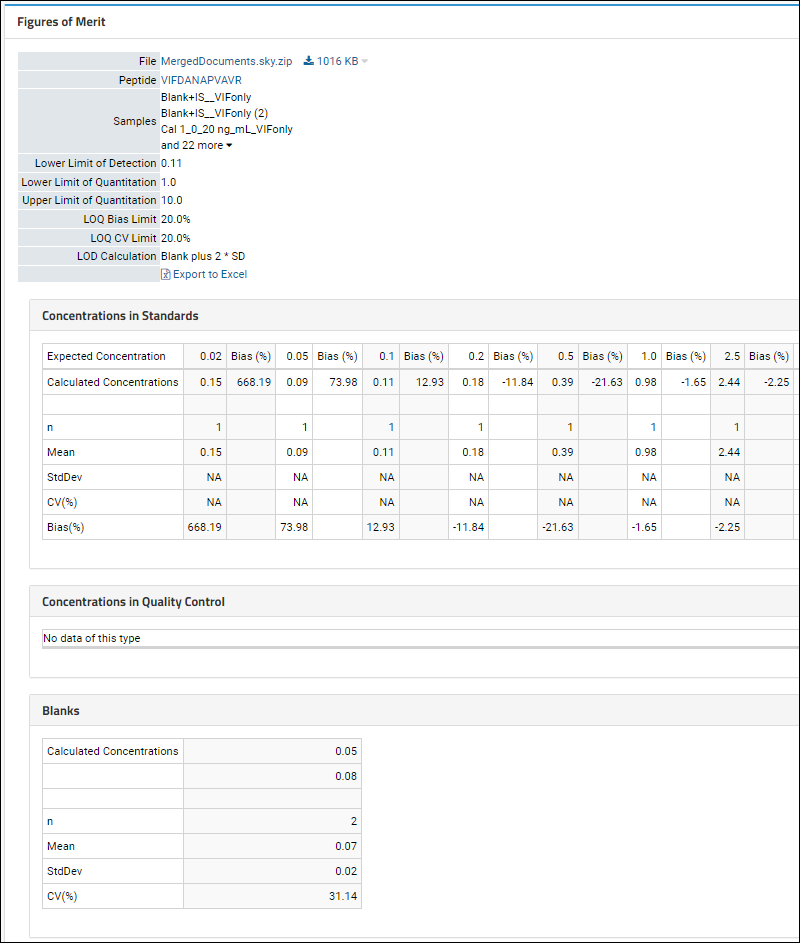
The report includes the following values for both
Concentrations in Standards and
Concentrations in Quality Control, if present:
- n - The Number of samples used for above calculations.
- Mean - The mean of all replicates for a given sample.
- StdDev - Standard deviation of all replicates for a given sample.
- CV(%) - Coefficient of Variation for all replicates for a given sample (the standard deviation divided by the mean).
- Bias(%) - The difference between expected and observed values.
Point exclusions are imported, and any excluded raw data is shown as strike-through text. Excluded values are not included in summary calculations.
Summary: LOD/LOQ Values
Within Skyline, you can set the limit of detection (LOD) calculation, the coefficient of variation (CV) limit, and limit of quantitation (LOQ) bias. These settings are picked up automatically by LabKey and included in the Figures of Merit report in Panorama.
Key terms:
- Limit of detection (LOD) - the lowest quantity of a substance that can be distinguished from the absence of that substance
- Limit of quantitation (LOQ) - the lowest concentration at which the analyte can not only be reliably detected but at which some predefined goals for bias and imprecision are met. It is typically higher than the LOD. Note that LOQ can come in lower (LLOQ) and upper (ULOQ) varieties.
- Bias - difference between expected and observed values, often represented as a percent. If no value is provided for either bias or CV, the bias cutoff will default to 30% and the CV will be ignored.
- Coefficient of variation (CV) - ratio of the standard deviation to the mean.
To set these values in Skyline, open
Settings > Peptide Settings > Quantification tab.
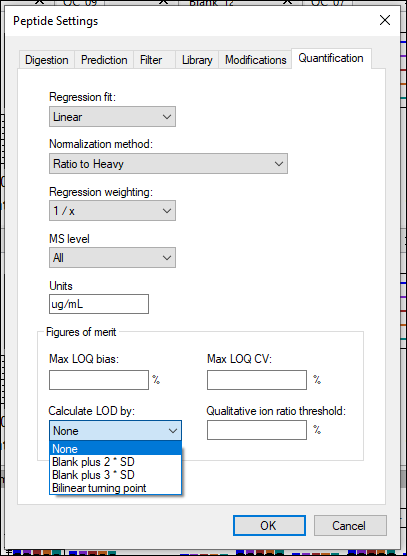
Enter:
- Max LOQ bias: Maximum (percentage) allowed difference between the actual internal value and the calculated value from the calibration curve.
- Max LOQ CV: Maximum allowed coefficent of variation of the observed peak areas of the set of internal standard replicates with a specified concentration.
- Select how to Calculate LOD from the following options:
- None
- Blank plus 2 * SD: Base the limit of detection on the observed peak areas of the blank samples. Add twice the standard deviation.
- Blank plus 3 * SD: Add three times the standard deviation to the observed peak areas of the blank samples.
- Bilinear turning point: Impute the limit of detection using the turning point of bilinear fit.
- Qualitative ion ratio threshold
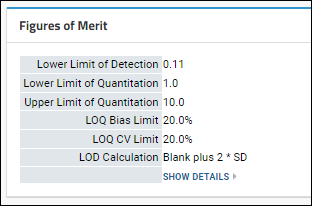
Both limit of detection and limit of quantification results are shown in the summary Figures of Merit section below the calibration curve (as well as at the top of the details page).
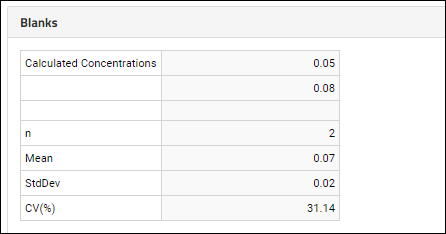
Blanks
The raw data for blanks is show at the bottom of the figures of merit report. The same statistics, except bias, are displayed as in the concentrations sections.
Pharmacokinetic (PK) Calculations
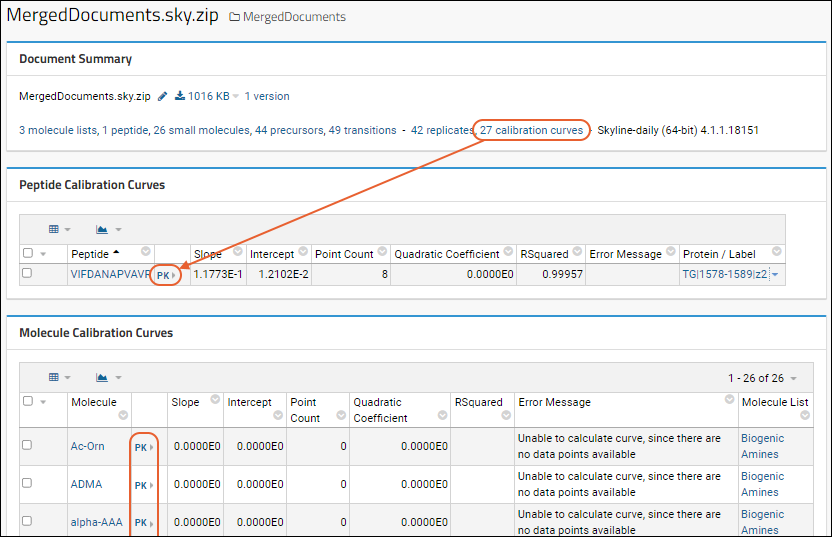
To view the Pharmacokinetic values:
- For a given Skyline document, click the Calibration Curves link.
- In the Peptides Calibration Curves panel, click PK for a given peptide.
- The link is only shown if your replicates have the Dose and Time annotations.
PK Calculations Panel
For successful PK calculations, the following annotations should be present on the Replicate data as configured in Skyline:
- Dose: number (Dose that was administered)
- DoseUnits: text (Units for what was administered, such as "mg/kg")
- Time: number (Timepoint after administration)
- ROA: text (Route of Administration, typically "IM" or "IV")
- SubGroup: text (Optional) Grouping of data within a single Skyline document
The
Pharmacokinetic report provides a panel of PK values, and if subgroups are provided, a panel for each subgroup.
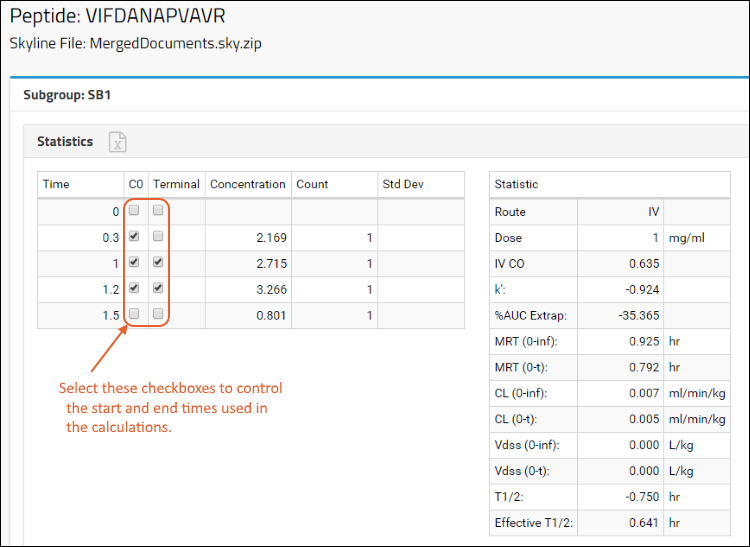
Use the checkboxes to set values for the C0 and Terminal columns. These indicate which timepoints are used as the starting and ending points of the calculations. By default the earliest 3 timepoints for C0 and the last 3 timepoints for the Terminal values are selected.
The Time column in the spreadsheet will be a custom replicate annotation in the Skyline document. There will also be replicate annotations for Dose, DoseUnits, ROA (Route of Administration), and SubGroup. Dose and DoseUnits may be added to one or more replicates per SubGroup. When Dose is included on more than one replicate is must be the same value. The same applies for DoseUnits and ROA.
You can print the data to Excel by clicking the icon in the
Statistics header.
Non-IV Route of Administration
If the ROA (Route of Administration) is any value other than “IV” the subgroup will have an input field for “non-IV C0” and a button to
Recalculate.

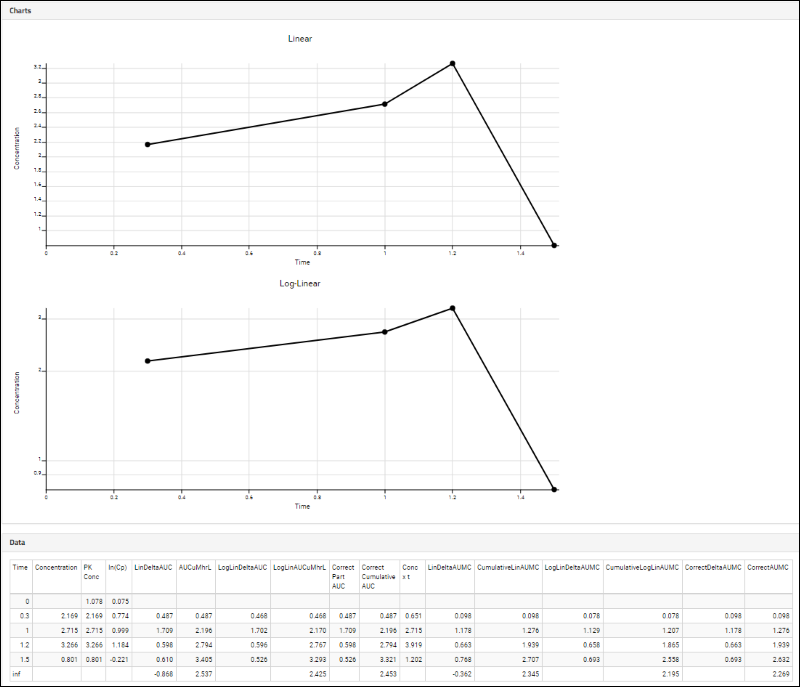
Charts and Raw Data
Scroll down the page to see charts and raw data panels for this subgroup, followed by sets of panels for other subgroups.
Related Topics
 Scroll below the Calibration Curve on the details page to the Figures of Merit panel. Summary information, including LOD/LOQ Values, is shown here.
 The report includes the following values for both Concentrations in Standards and Concentrations in Quality Control, if present:
 Enter:


 Use the checkboxes to set values for the C0 and Terminal columns. These indicate which timepoints are used as the starting and ending points of the calculations. By default the earliest 3 timepoints for C0 and the last 3 timepoints for the Terminal values are selected.The Time column in the spreadsheet will be a custom replicate annotation in the Skyline document. There will also be replicate annotations for Dose, DoseUnits, ROA (Route of Administration), and SubGroup. Dose and DoseUnits may be added to one or more replicates per SubGroup. When Dose is included on more than one replicate is must be the same value. The same applies for DoseUnits and ROA.You can print the data to Excel by clicking the icon in the Statistics header.

