In this step we will look at the variety of reports available in the online example. We will look at both built-in reports (automatically available in all study folders) and custom reports (created by the study researchers or data analysts).
As you progress with the walkthrough, notice two things:
- First, all of these reports are 'live', that is, they represent the current state of the underlying data. If the data were changed, all of these reports would be updated without any user interaction.
- Second, most of these reports support viewer customization "on the fly", such as by filtering the underlying data, or changing report parameters. This empowers your (authorized) audience to apply their own questions to the research data as they explore.
Note that all of the links in this tutorial open their targets in new browser tabs. To open the links in a new window, hold down the Shift key and click the link.
View Built-in Reports
The following built-in reports are automatically part of a LabKey study folder. Note that this tour touches on only a subset of the available built-in reports.
Main Study Overview
- From the Overview tab, click the Study Navigator graphic. You can also click this link to view this report. (Opens in a new tab.)
- This overview report displays a high-level view of data collection in the study and provides a convenient jumping-off point to specific facets of the data.
- Each dataset is listed as a row. Each timepoint or visit is listed as a column. The cells indicate how much data is available for each dataset for that particular time in the study.
- Each cell's displayed number is a link to a filtered view of that data.
- The Study Overview also shows whether participants are completing visits and can help a researcher confirm that the necessary data is being gathered for the purpose of the study. Seen below, with physical exam data collected for 12 participants per visit, the study seems on track.
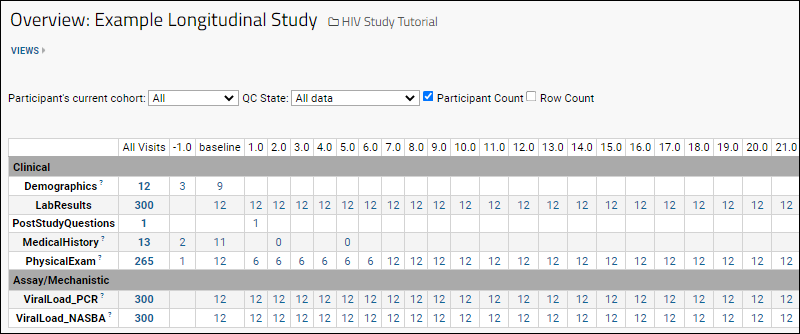
- Notice that the dropdown options above the grid allow you to filter by either Participant's current cohort or QC State of the data. The following sections explore these options.
- You can also use the checkboxes to switch between viewing counts of participants and counts of rows for each visit.
Quality Control: Study-wide Picture of QC State
You can filter the Study Overview grid to provide a view of the quality control states of data across the whole study.
- Click to View the Report. (Opens in a new tab.)
- The Overview is also filterable by quality control state. As shown below, the report has been modified to show only data that has 'not been reviewed' by the quality control process. Use the dropdown to see other quality control states.

Quality Control: Not Yet Reviewed Details
If you click the number in a cell in the overview report, you'll go directly to the details of which data is represented by that count. You can also find rows needing attention from within a dataset, such as by using conditional formatting on the QC State column, as shown in the custom grid view in this report.
- Click to View the Report. (Opens in a new tab.)
- This report shows the 2 rows of data that need quality control review.
- We have added a pie chart to help alert the team that some verification tasks are not 100% complete.
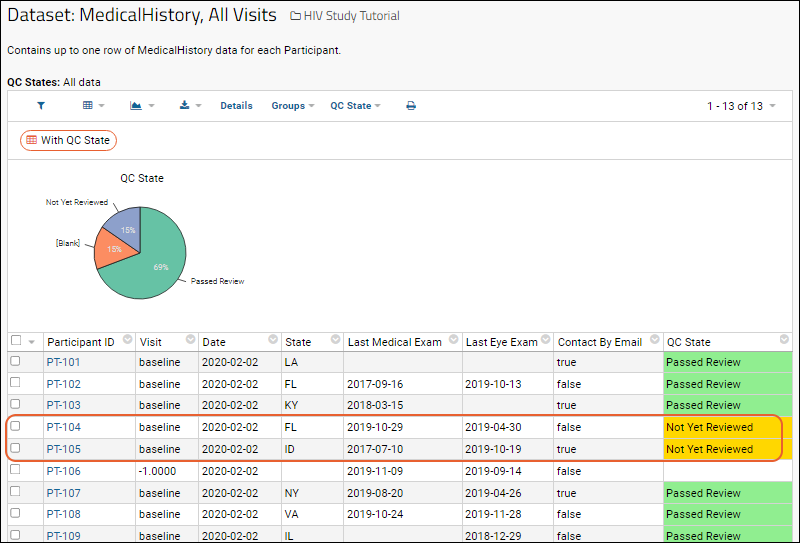
- Click the header for the QC State column to see where the pie chart option was selected.
View Data for one Visit
- Click to View the Report. (Opens in a new tab.)
- OR, to navigate manually: Click the Overview tab, then click the Study Navigator, then click the link at the intersection of the Physical Exam row and the Visit 2.0 column.
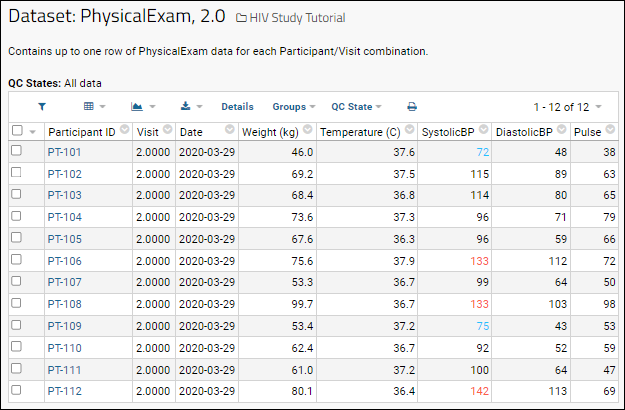
- The resulting data grid shows all physical exams conducted at "visit 2" for each participant.
- Also notice that the Systolic Blood Pressure column makes use of conditional formatting to display values configured to be noteworthy in blue (low) and red (high).
View Data for Individual Participants
- Click to View the Report. (Opens in a new tab.)
- OR, to navigate manually, click PT-105 from the Participants tab.
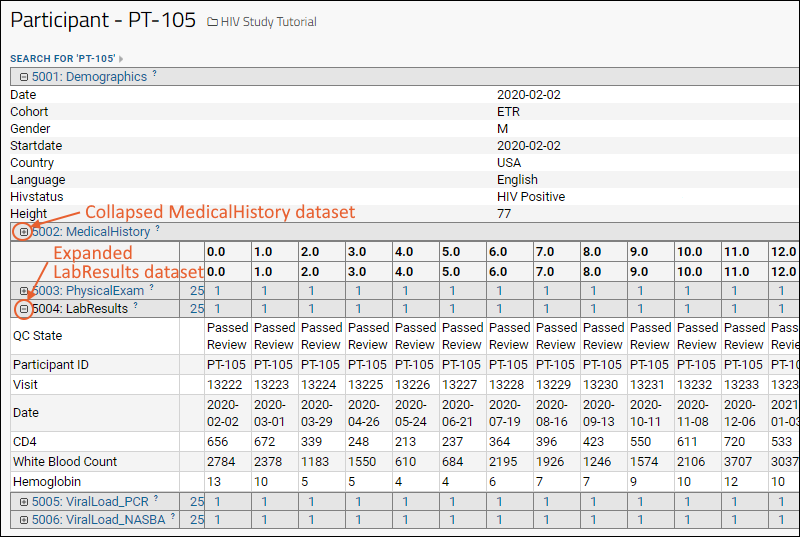
- The participant page shows demographic data and a list of datasets isolated out for this participant, PT-105.
- Click the (collapse) icon for the MedicalHistory dataset.
- Click the (expand) icon next to 5004: Lab Results to open details of this dataset for this participant.
- If you access data for an individual participant from within a dataset where participants are ordered, you will have additional links for scrolling through the different subjects: Next Participant and Previous Participant. These are not provided if you directly access the participant page.

Custom Reports
The following reports were custom built by administrators and data specialists.
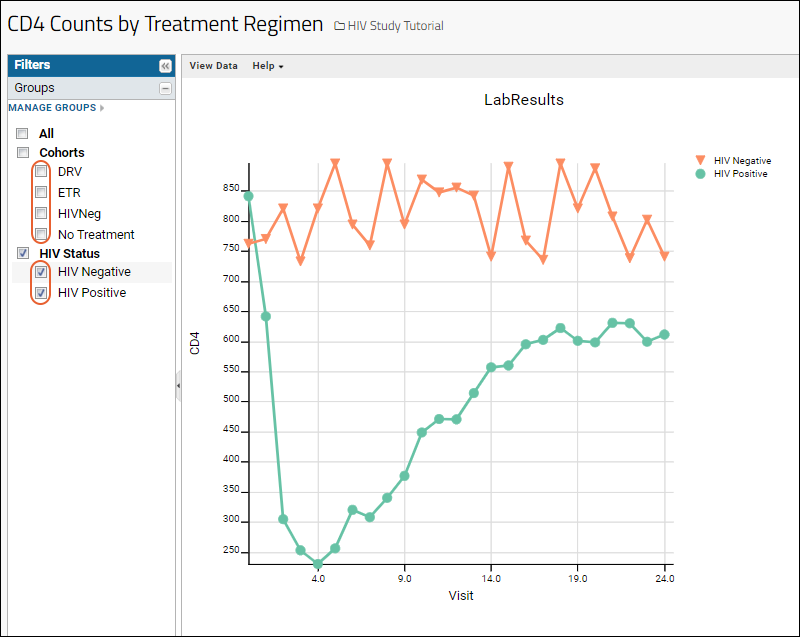
Visualization: Main Result
- Click to View the Report. (Opens in a new tab.)
- This is the main finding of the research study: different CD4 performance for different treatment regimens.

- Notice that you can control the groups displayed in the report by checking and unchecking items in the left pane.
Combined Datasets
- Click to View the Report. (Opens in a new tab.)
- This data grid is combined from 4 different base datasets: Demographics, Lab Results, ViralLoad-PRC, and ViralLoad-NASBA.
- All study datasets share the Participant ID, Visit, and Date columns.
- When you combine datasets in this manner, aligning by participant over time, you unlock the ability to analyze information that spans multiple spreadsheets easily. All the built in tools for creating plots and reports can be applied to these 'joined' dataset grids.


