LabKey must first be configured to accept external analytics integrations using an ODBC connection. At all times, LabKey security settings govern who can see which data; any user must have at least the Reader role to access data from Tableau.
Learn more about setting up the ODBC connection in LabKey in these topics:
Once configured, load LabKey data into Tableau following the instructions in this section:
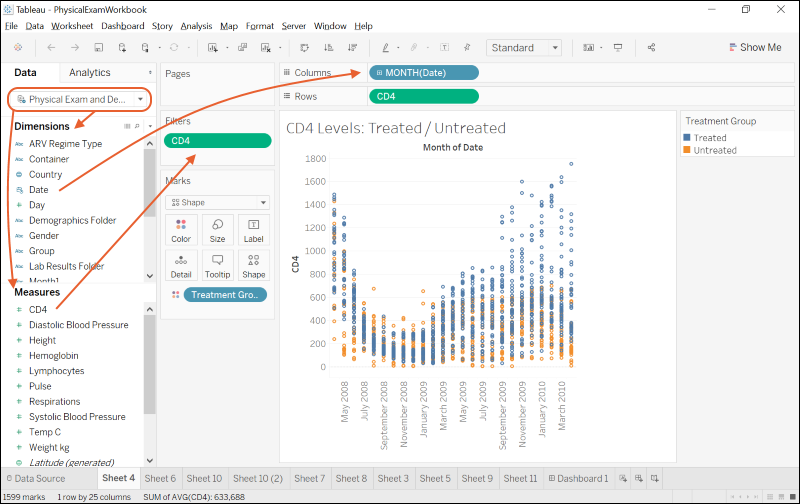
Within Tableau, once you have loaded the data table you wish to use, you can see the available measures and dimensions listed. Incorporate them into the visualizations by dragging and dropping. Instructions for using Tableau Desktop can be found on their website.
In this example, the Physical Exam and Demographics joined view is being used to create a plot showing the CD4 levels over time for two Treatment Groups, those treated and not treated with ARV regimens.

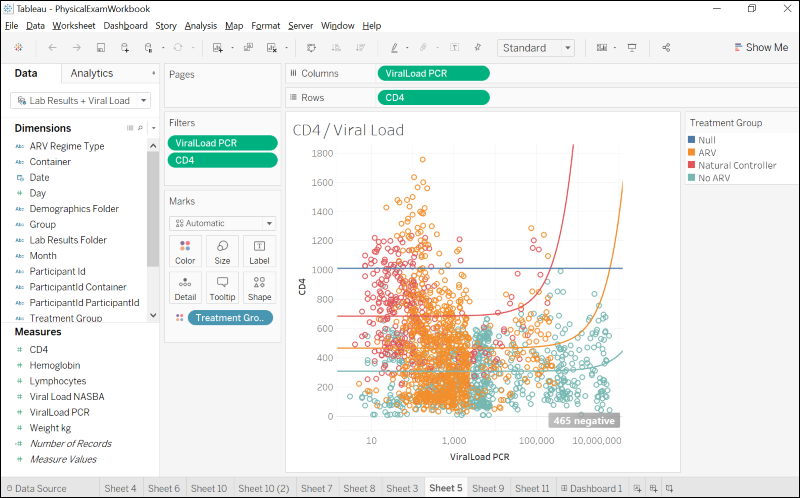
Tableau also offers the ability to easily create trend lines. Here an otherwise cluttered scatter plot is made clearer using trend lines:

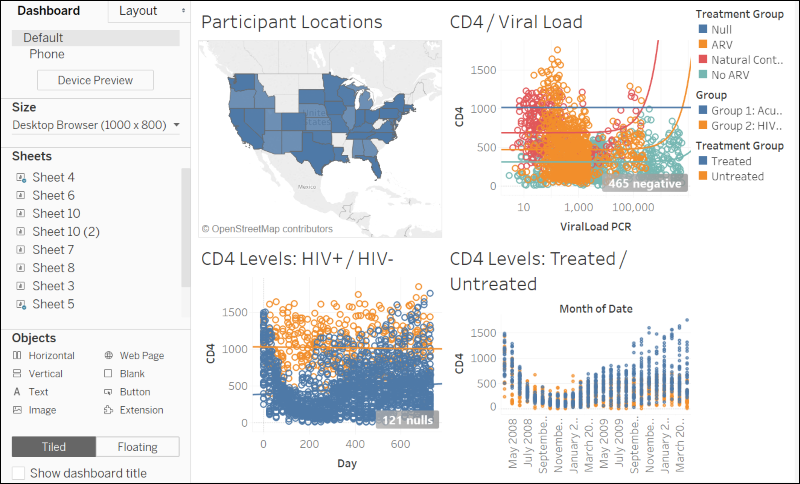
You can build a wide variety of visualizations and dashboards in Tableau.

This video covers the ways in which LabKey Server and Tableau Desktop are great partners for creating powerful visualizations.
| previousnext |
| expand allcollapse all |