With a LabKey study, creating a
participant report lets you show data for one or more individual participants for selected measures. Measures from different datasets in the study can be combined in a single report. A filter panel lets you dynamically change which
Create a Participant Report
- In a study, select > Manage Views.
- Choose Add Report > Participant Report.
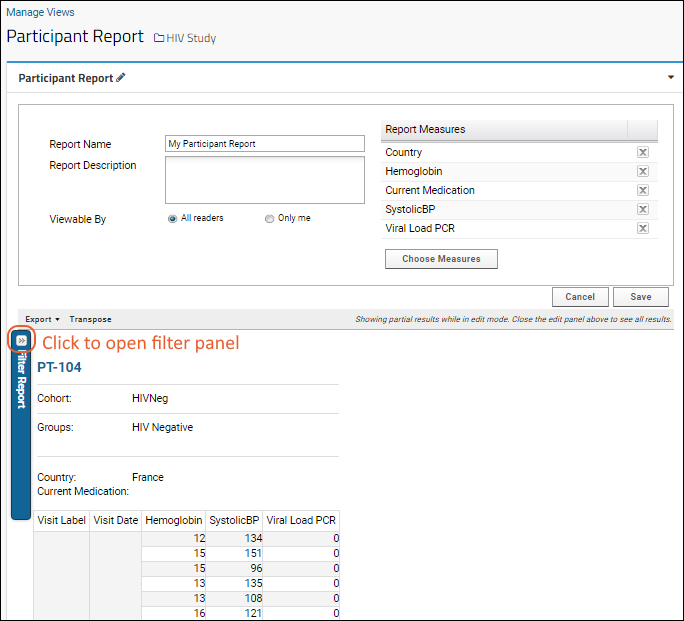
- Click Choose Measures, select one or more measures, then click Select.
- Enter a Report Name and optional Report Description.
- Select whether this report will be Viewable By all readers or only yourself.

- When you first create a report, you will be in "edit mode" and can change your set of chosen measures. Below the selection panel, you will see partial results.
- Toggle the edit panel by clicking the (pencil) icon at the top of the report to see more results; you may reopen it at any time to further edit or save the report.
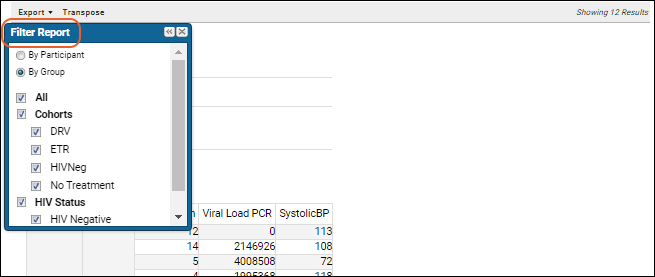
- Click the Filter Report (chevron) button to open the filter panel to refine which participants appear in the report.

- Select desired filters using the radio buttons and checkboxes. You may hide the filter panel with the , or if you click the X to close it entirely, a Filter Report link will appear on the report menu bar.
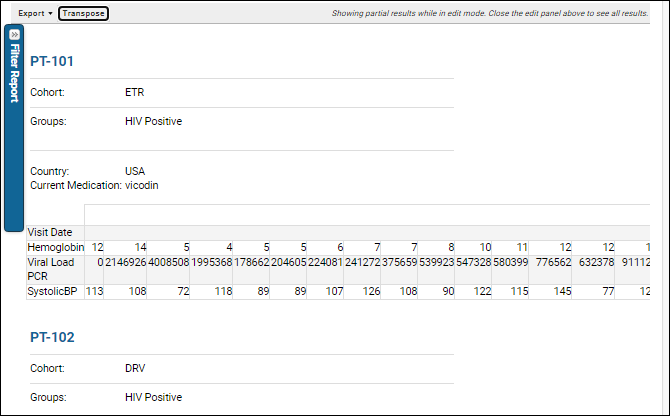
- Click the Transpose button to flip the columns and rows in the generated tables, so that columns are displayed as rows and vice versa, as shown below.

- When you have created the report you want, click Save.
- Your new report will appear in the Data Views.
Export to Excel File
- Select Export > To Excel.
Add the Participant Report as a Web Part
- Enter > Page Admin Mode.
- Select Report from the <Select Web Part>, select Report.
- Name the web part, and select the participant report you created above.
- Click Submit.
- Click Exit Admin Mode.
Related Topics

