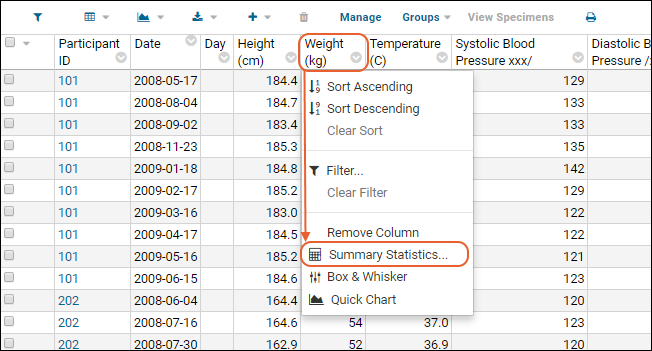
Summary statistics for a column of data can be displayed directly on the grid, giving at-a-glance information like count, min, max, etc. of the values in that column.
Add Summary Statistics to a Column
Display Multiple Statistics
Multiple summary statistics can be shown at one time for a column and each column can have it's own set. Here is a compound set of statistics on another dataset:

Statistics Available
The list of statistics available vary based on the edition of LabKey Server you are running, and on the column datatype. Not all functions are available for all column types, only meaningful aggregates are offered. For instance, boolean columns show only the count fields; date columns do not include sums or means. Calculations ignore blank values, but note that values of 0 or "unknown" are not blank values.
All calculations use the current grid view and any filters you have applied. Remember that the grid view may be shown across several pages. Column summary statistics are for the dataset as a whole, not just the current page being viewed. The number of digits displayed is governed by the
number format set for the container, which defaults to rounding to the thousandths place.
Summary statistics available in the Community edition include:
- Count (non-blank): The number of values in the column that are not blank, i.e. the total number of rows for which there is data available.
- Sum: The sum of the values in the column.
- Mean: The mean, or average, value of the column.
- Minimum: The lowest value.
- Maximum: The highest value.
Additional summary statistics available in Premium editions of LabKey Server include:
- Count (blank): The number of blank values.
- Count (distinct): The number of distinct values.
- Median: Orders the values in the column, then finds the midpoint. When there are an even number of values, the two values at the midpoint are averaged to obtain a single value.
- Median Absolute Deviation (MAD): The median of the set of absolute deviations of each value from the median.
- Standard Deviation (of mean): For each value, take the difference between the value and the mean, then square it. Average the squared deviations to find the variance. The standard deviation is the square root of the variance.
- Standard Error (of mean): The standard deviation divided by the square of the number of values.
- Quartiles:
- Lower (Q1) is the midpoint between the minimum value and the median value.
- Upper (Q3) is the midpoint between the median value and the maximum value. Both Q1 and Q3 are shown.
- Interquartile Range: The number of values between Q3 and Q1 in the ordered list. Q3-Q1.
Save Summary Statistics with Grid View
Once you have added summary statistics to a grid view, you can use
(Grid Views) > Customize Grid to save the grid with these statistics displayed. For example, this grid in our example study shows a set of statistics on several columns (scroll to the bottom):
For example, this grid in our example study includes both column visualizations and summary statistics:
Related Topics
