In some cases you may want to flag certain wells and/or analytes as unreliable, in order to exclude the unreliable data from later analysis.
A
replicate group is a set of wells that all contain the same sample at the same dilution. For example, the replicate groups in the sample data file used in this tutorial each encompass two wells. Each pair of wells contains the same unknown sample at the same dilution. In the data file, wells that are part of a replicate group are listed in sequential rows and have the same value in the "Type" column; for example, the two wells with a "Type" of "X1" are part of one replicate group.
For example, you might wish to exclude an analyte's results for all sample wells in a replicate group because fluorescence intensities reported for that analyte for that group had high coefficients of variation. Alternatively, you might wish to exclude all measurements for the entire run for a particular analyte after discovering that this analyte was bound to beads from a defective lot.
Note that when data is excluded, the assay run including transform script curve fits will be recalculated without that data which can take considerable time. These exclusion reruns are pushed onto the pipeline job list so that you may continue working and check on status later. When you define a new exclusion you may opt to view the status log immediately in order to wait for completion instead.
Exclude Analytes for a Replicate Group
Here, you will exclude a single analyte for all sample wells within a replicate group, in this case there are two wells per group.
In this example scenario, since the fluorescence intensity reported for an analyte in a well is the
median for all beads bound to that analyte in that well, you might exclude the analyte if the reported coefficient of variation for the group was unusually high.
Filter Results to a Replicate Group
Filter the results grid so that you see only unknowns, not background, standard or control wells.
- On the Luminex Assay 100 Results page, click the column header for the Well Role column.
- Select Filter.
- In the filter popup on the Choose Values tab, select the Unknown option only. Click the label Unknown to select only that checkbox.
- Click OK.
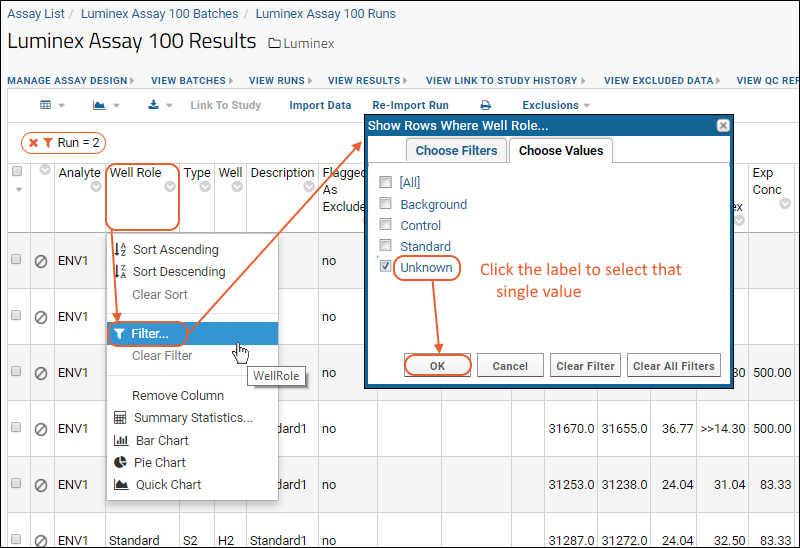
Notice that the grid now shows your new filter, as well as a filter to show only the specific run. Before continuing to the next step of modifying the default grid view,
clear the run filter by clicking the 'X' (your run number will likely be different). Otherwise the default grid view will only show this particular run going forward.

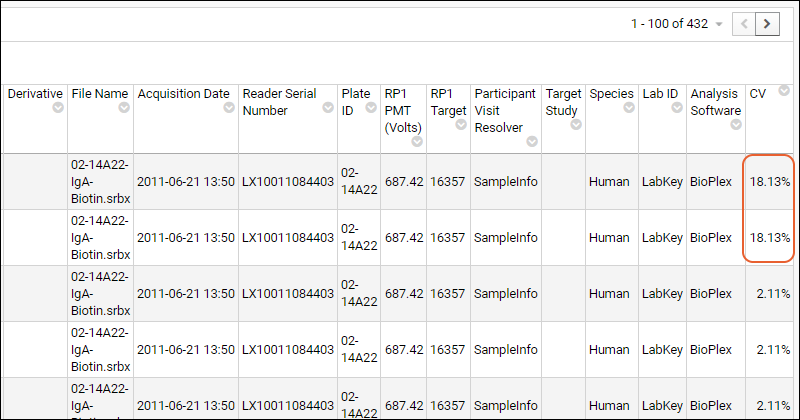
Customize the results grid to show instrument-reported coefficients of variation for each well:
- Select (Grid Views) > Customize Grid.
- In the Available Fields panel, scroll down, click the box for CV, then click Save. Confirm that "Default grid view for this page" is selected, and click Save again.
- Scroll to the far right and note that the first two wells for ENV1 (a replicate pair) show much higher CV than the other wells for this analyte.
Exclude Data for the Replicate Group
To exclude data for a replicate group, click the
(circle/slash) icon for a row in the group. Select the replicate group using the checkbox, then choose whether all analytes for the sample group are excluded, or just the row you picked initially.
- Click the (circle/slash) icon on the second row:
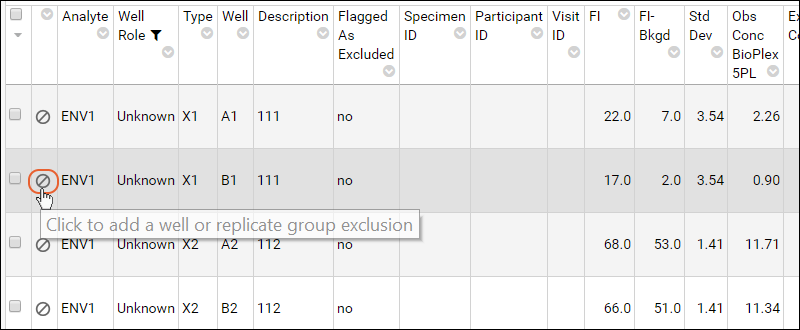
- In the Exclude Well or Replicate Group from Analysis popup:
- Check the box for "Replicate Group".
- Click Exclude selected analytes.
- Check the box for ENV1 to exclude this analyte.
- This exclusion will apply to analyte ENV1 in a replicate group that includes wells A1 and B1.
- Click Save.

- A popup message will explain that the exclusion will run in the background, via the pipeline - you have the option to view the pipeline status log to await completion. For this tutorial, just click No and continue; this small exclusion will run quickly.
To undo a replicate group exclusion, you would again click on the
(circle/slash) icon for the excluded row, then uncheck the relevant analytes in the popup and click
Save again.
Exclusion Color Coding and Reasons
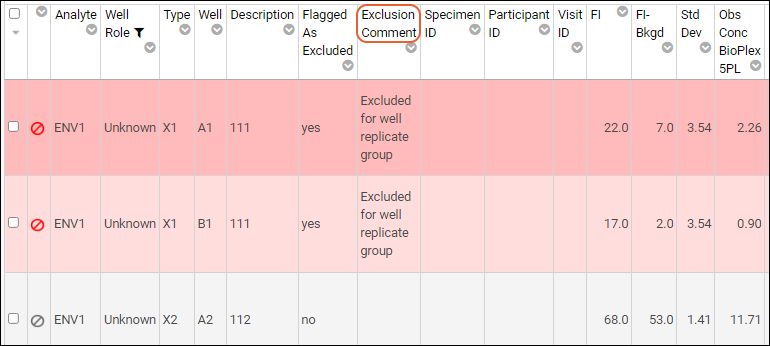
Once excluded, the rows are color coded with red/pink and the
Flagged As Excluded field changes value from "no" to "yes". Use this field to sort and filter the assay data, if desired.
- Refresh the Luminex Assay 100 Results page by clicking View Results.
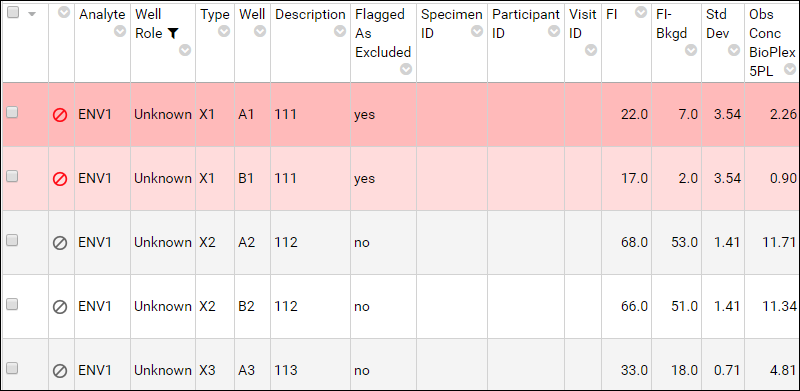
You can also see an example in the
interactive example.
For additional detail about why a given row is marked as excluded, you can
customize the grid view to include the
Exclusion Comment field. This can help you identify whether the row is excluded as part of a well group, analyte exclusion, etc.
Exclude Analytes Regardless of Replicate Group
Next, we exclude a given analyte for all wells in the run. For example, you might wish to exclude all measurements for a particular analyte if you realized that this analyte was bound to beads that came from a problematic lot.
- On the Luminex Assay 100 Results grid, select Exclusions > Exclude Analytes.
- Where is the Exclusions menu option? You must have editor or higher permissions to see this option. If you still don't see the option, your results view is probably unfiltered. The button only appears for results that have been filtered to one particular run.
- To make the button appear, click Luminex Assay 100 Runs at the top of the page, then click the run name -- this filtered result view will include the Exclusions menu if you have editor or higher permissions.
- In the Exclude Analytes from Analysis popup, select ENV5.
- Notice that there is no Wells field; exclusions apply to all replicate groups.
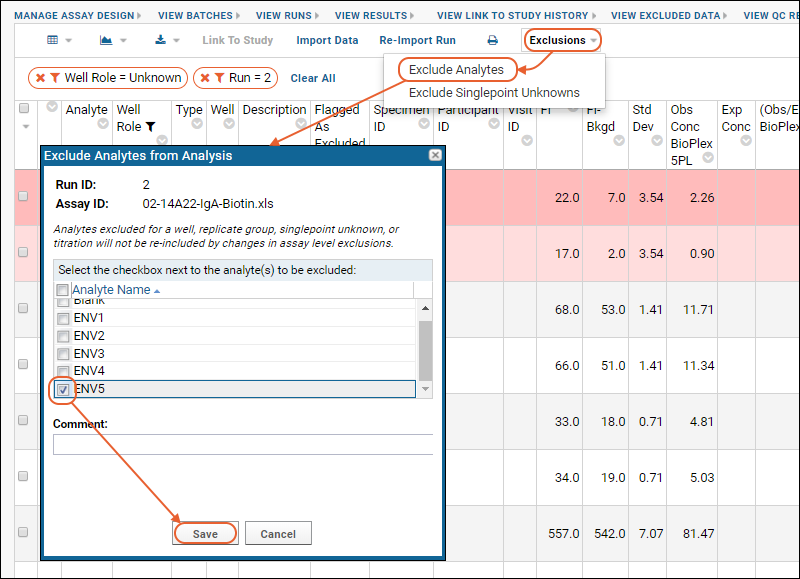
- Click Save.
- Click No in the popup message offering the option to view the pipeline status.
To remove an analyte exclusion, select
Exclusions > Exclude Analytes again. In the popup dialog, clear any exclusion checkmarks, and click
Save.
Exclude Titration
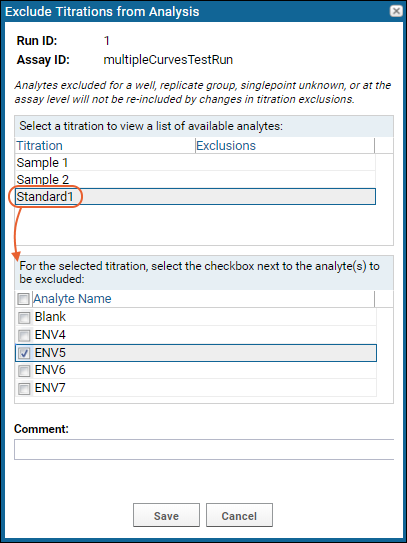
When you exclude data from a well-group within a titration, the assay is re-calculated (i.e. the transform script is rerun and data is replaced). If you want to exclude all well groups for a given titration, you can do so without recalculating by selecting
Exclusions > Exclude Titration and specifying which titration to exclude. Note that you cannot exclude a "Standard" titration.
The sample data used for this tutorial does not include an excludable titration. If it did, there would be an Exclude Titration option under Exclude Analytes on the Exclusions menu.

The exclusion popup in this case lets you select each titration present and check which analytes to exclude for that titration. Note that analytes excluded already for a replicate group, singlepoint unknown, or at the assay level will not be re-included by changes in titration exclusion.
Exclude Singlepoint Unknowns
To exclude analytes from singlepoint unknown samples, select
Exclusions > Exclude Singlepoint Unknowns. The unknown samples are listed, and you can select each one in turn and choose one or more analytes to exclude from only that singlepoint.
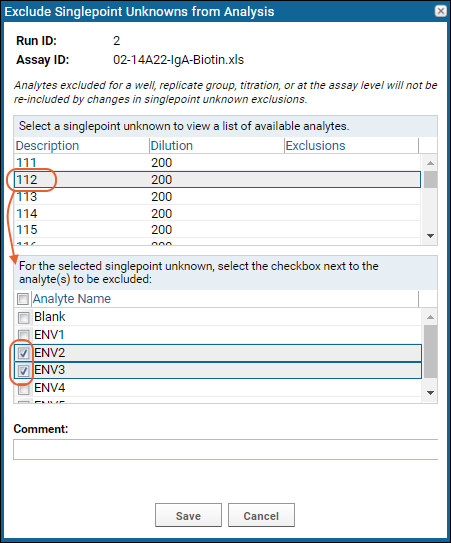
Note that analytes excluded for a replicate group, titration, or at the assay level will not be re-included by changes in singlepoint unknown exclusions.
Exclude Individual Wells
When you open the UI to
exclude a replicate group, the default option is to only exclude the single well for the row you selected. You can choose to exclude all analytes or only selected analytes for that well.
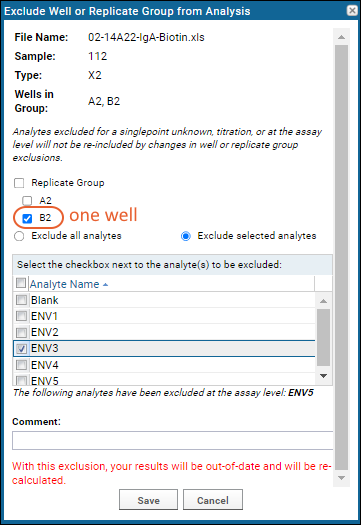
View All Excluded Data
Click
View Excluded Data above the results grid to see all exclusions in a single page. This might help you see which data needs to be re-run. You could of course view excluded rows by filtering the grid view on the
Flagged as Excluded column, but the summary page gives a summary of exclusions across multiple runs.
If you are looking at the results grid for a single run, the
View Excluded Data report will be filtered to show the exclusions for that run.
- On the results grid, click View Excluded Data
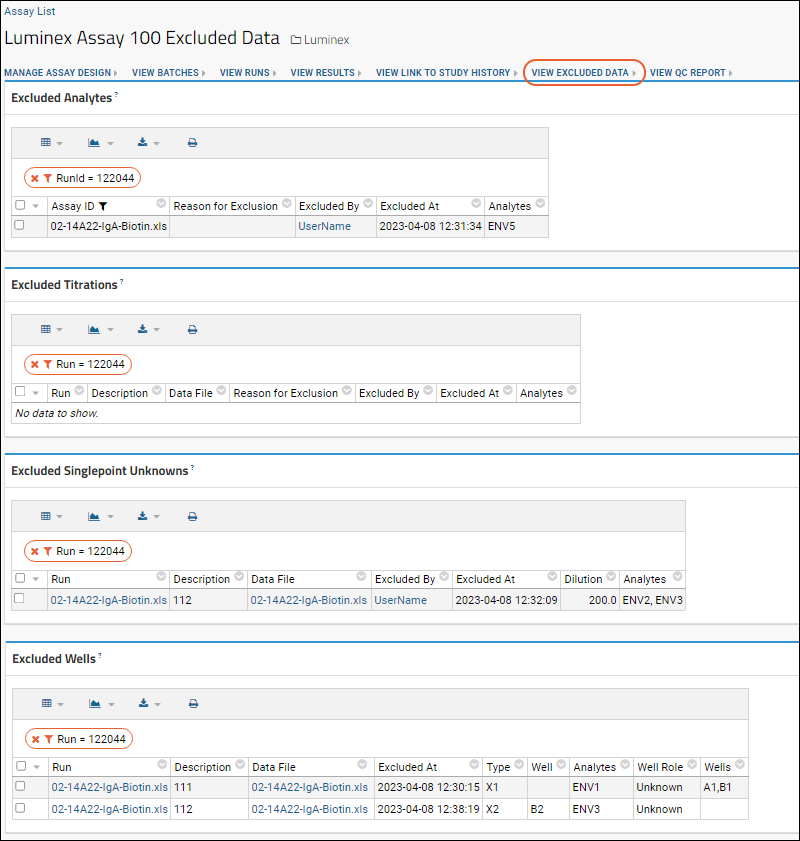
You can see a similar view in the
interactive example.
Reimport Run with Exclusions
Return to the list of runs by clicking
View Runs. If you wanted to reimport the run, perhaps to recalculate positivity, you could do so by selecting the run and clicking
Reimport Run. Note that the previous run data will be deleted and overwritten with the new run data.

You will see the same entry screens for batch and run properties as for a new run, but the values you entered previously will now appear as defaults. You can change them for the rerun as necessary. If exclusions have been applied to the run being replaced, the analyte properties page will include an
Exclusion Warning panel.
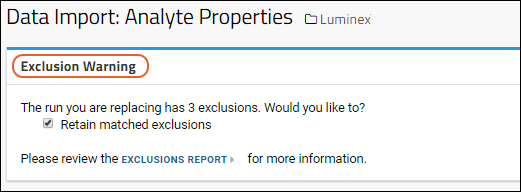
The panel lists how many exclusions are applied (in this case one replicate group, one analyte, and one single point control). Click
Exclusions Report to review the same report as you saw using the "View Excluded Data" link from the run data grid. Check the
Retain matched exclusions box to retain them; then click
Save and Finish to initiate the reimport.
If any exclusions would no longer match based on the reimport run data, you will see a red warning message saying the exclusion will be lost if you proceed with the import.
[
Video Overview: Retain Luminex Exclusions on Reimport ]
When the reimport is complete, click the name of the run to see the reimported data, with any exclusions you chose to retain.
If you don't see data at this point, you may have saved the default view of your grid with a run filter. Now that the run has been reimported, the run ID is different. To resolve this issue:
- Select (Grid Views) > Customize Grid.
- Click the Filters tab.
- Clear the Row ID filter by clicking the 'X' on it's line.
- Click Save, confirm Default grid view for this page is selected.
- Click Save again.
Edit or Remove Exclusions
To edit an exclusion, reopen the panel where you originally added the exclusion at that level. Adjust the settings and save. As with the original exclusion, this operation will run in the background.
To remove an exclusion, edit it and remove all selections before saving.
Does LabKey Server re-calculate titration curves when I exclude a replicate group?
This happens only when your assay design is associated with a transform script (see:
Luminex Assay Tutorial Level II). When you exclude an entire
replicate group from a
titrated standard or quality control, LabKey Server automatically re-runs the transform script for that run.
This is desirable because changing the replicates included in a titration affects the calculations that the script performs for the curve fits and other measure (
e.g., EC50, AUC, HighMFI,
etc., as defined in
Luminex Calculations).
If you exclude a replicate group that is not part of a titration (
e.g., part of an unknown), the calculations performed by the script will be unaffected, so the script is not re-run.
Does LabKey Server do automatic flagging of run data outliers during data import?
During data import, LabKey Server adds a quality control flag to each data row where reported
FI is greater than 100
and %CV (coefficient of variation) is outside of a certain threshold. For unknowns, the %CV must be greater than 15 to receive a flag; for standards and quality controls, the %CV must be greater than 20.
Columns flagged through this process are highlighted in red. If flagging is later disabled, the row is no longer highlighted.
To see all rows that received flags according to these threshholds, you can add the
CVQCFlagsEnabled column to a Luminex data or results view and filter the data using this column. The column is hidden by default.
 Notice that the grid now shows your new filter, as well as a filter to show only the specific run. Before continuing to the next step of modifying the default grid view, clear the run filter by clicking the 'X' (your run number will likely be different). Otherwise the default grid view will only show this particular run going forward.