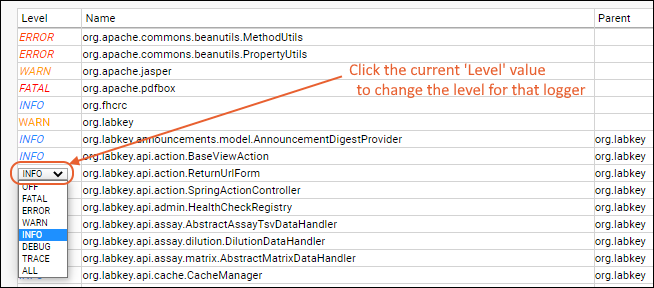
 For example, while investigating an issue you may want to set a particular logging path to DEBUG to cause that component to emit more verbose logging. Typically, your Account Manager will suggest the logger(s) and level to set.Another way to use the adjustability of logging is to lower logging levels to limit the growth of the labkey.log file. For example, if your log is filling with INFO messages from a given logger, and you determine that these messages are benign, 'raising' the threshold for messages being written to the log (such as to ERROR) will reduce overall log size. However, this also means that information that could help troubleshoot an issue will not be retained.Learn more about logger file sizes in this topic: Troubleshoot Installation and Configuration
| Logger | Level | Result in Log |
|---|---|---|
| org.apache.jasper.servlet.TldScanner | DEBUG | A complete list of JARs that were scanned but no TLDs were found in them. Skipping unneeded JARs during scanning can improve startup time and JSP compilation time. |
| org.labkey.api.files.FileSystemWatcherImpl | DEBUG | Open file system handlers and listeners. For example, whether a file watcher is finding no files, or finding files that have already been 'ingested'. |
| org.labkey.api.admin.FolderImporterImpl | DEBUG/ALL | Details about folder import, including from file watchers. Will include what type of listener is used for the watcher as well as any events for the configuration. |
| org.labkey.api.admin.FolderImporterImpl org.labkey.api.pipeline.PipelineService org.labkey.api.pipeline.PipelineJob org.labkey.study.pipeline.DatasetImportRunnable | DEBUG/ALL | Details related to file watcher actions such as study reloading. |
| org.labkey.api.pipeline.PipelineService | DEBUG | Details related to file watcher configurations and mapped network drives. |
| org.labkey.api.data.ConnectionWrapper | DEBUG | All JDBC meta data calls being made. Includes attempts to load tables from an external schema. |
| org.labkey.api.websocket.BrowserEndpoint | ALL | Details related to browser windows briefly appearing, then disappearing, such as for a color picker or RStudio/Shiny app. |
| org.labkey.api.data.SchemaTableInfoCache | DEBUG | See loading of tables from an external schema. |
| org.labkey.api.data.Table | DEBUG | Includes all SQL being executed against the database. |
| org.labkey.api.security.SecurityManager org.labkey.api.view.ViewServlet | DEBUG | Permissions related to API key access. |
| org.labkey.api.view.ViewServlet | DEBUG | Request processing details, including failed authentication. |
| org.labkey.audit.event.* | DEBUG | Additional detail about a specific type of audit event. |
| org.labkey.audit.event | DEBUG | Additional detail about all audit events. |
| org.labkey.cas.client.CasManager | DEBUG | Include XML responses from the server for CAS logins. |
| org.labkey.connectors.postgresql.SocketListener org.labkey.connectors.postgresql.SocketConnection | DEBUG | See information about ODBC conections. Troubleshooting ODBC Connections |
| org.labkey.core.webdav.DavController | DEBUG | See information about files being downloaded or uploaded; includes timing of setting metadata values related to transfers to/from S3. |
| org.labkey.ehr.* | DEBUG | Several EHR-specific loggers are available. |
| org.labkey.di.* | DEBUG | Several DataIntegration loggers are available for ETL debugging. |
| org.labkey.experiment.api.ExperimentServiceImpl | DEBUG | Query performance during upgrade. |
| org.labkey.ldap.LdapAuthenticationManager org.labkey.ldap.LdapAuthenticationProvider org.labkey.premium.LDAPSyncController | DEBUG/ALL | Details to help troubleshoot LDAP authentication problems. |
| org.labkey.saml.SamlConfiguration org.labkey.saml.SamlController org.labkey.saml.SamlManager | DEBUG | SAML configuration and authentication errors and warnings. |
| org.labkey.study.dataset.DatasetSnapshotProvider | DEBUG | Query snapshot refresh details. |
| org.labkey.targetedms.parser.PrecursorChromInfo | DEBUG | Messages about fetching chromatograms, either from the cache-in memory, or from S3/local files. |
| org.labkey.api.query.QueryService.QueryAnalysisService | DEBUG | Cross-folder dependency analysis details. |